Much as we are shocked by recent city seismic catastrophe, knowing what to expect next would soothe nerves and add hope in eventual recovery. This begins by realising that there is no level or agency of government – central or local, executive or public service – exercising precautionary principle and over-seeing our collective well-being here. That responsibility is all our own.
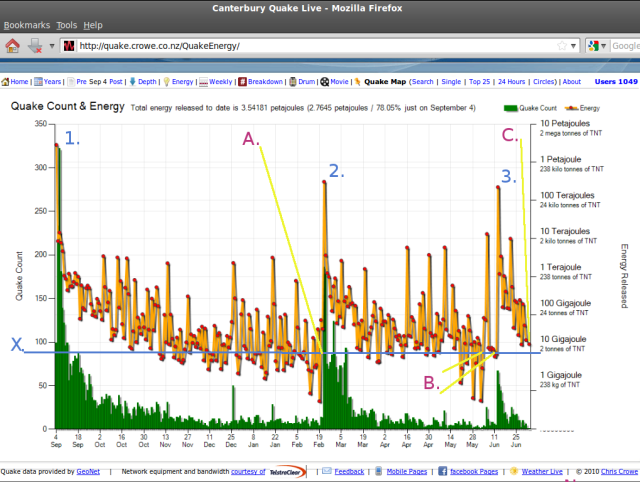
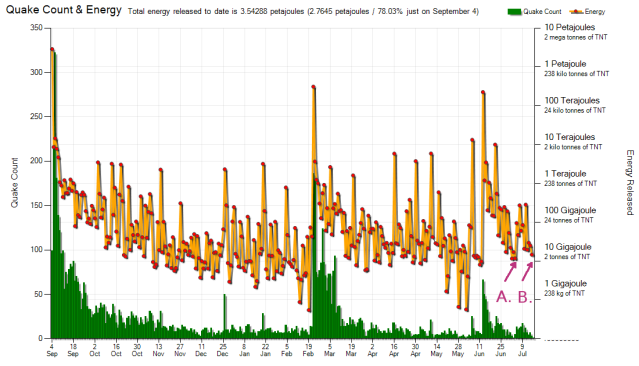
The graph http://quake.crowe.co.nz/QuakeEnergy can show us how soon to expect the next Christchurch 6+ earthquake, should there be one, by observing energy conditions between the previous three. Viz:
Local earthquakes:
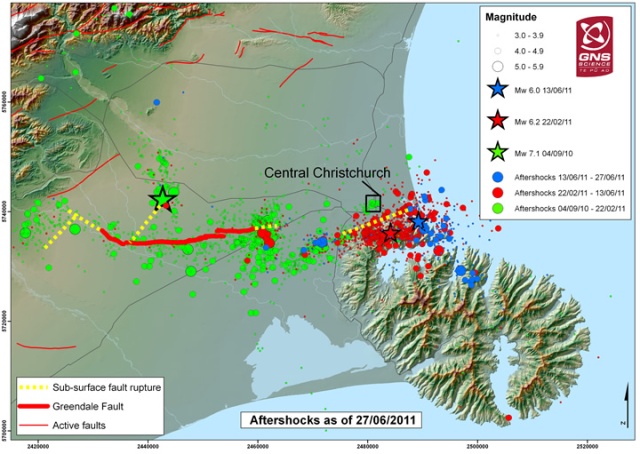
# 1. 4 September 2010, magnitude 7.1 ; # 2. 22 February 2011, 6.3 ; # 3. 13 June 2011, 6.3. [1]
Line X. is the 10-Gigajoule average daily energy-release marker: once daily aftershocks have fallen into this zone then the conditional driver for the next Christchurch 6+ earthquake is here.
Historic points A. and B. on line X. indicate where point C. is heading to in the near future – averaging ten gigajoules of aftershock daily energy release – which will shortly precede the next Christchurch 6+ earthquake, most likely, based on the local quake pattern to date.
Of course the number of aftershocks are tailing off over time, as shown by Crowe’s green bars. This can be deceptive, however, given these faults’ rock type and its reported ‘stickiness’ – a propensity to release friction in big, uneven jolts rather than smoothly. Hence community concern at the current seismically quieter period.
But the steady tailing off of aftershocks is what the geologist experts’ mathematical modelling has consistently predicted, so we can draw a measure of comfort from that. Their view that the ancient volcanic crater around Lyttelton Harbour / Te Whaka-raupo is absorbing shocks within its many concentric cooling faults seems real and reassuring. The fact that these analysts were entirely wrong in not foreseeing the second and third local main shocks, however, gives us every reason to extend public-good quake analysis by way of commentary such as this blog and community discussion. It honours those lost, by warning those still here who may face further civil emergency.
Extra info: Canterbury earthquake GNS Science media release:
Stay strong. Watch Chris Crowe’s graph.
~ Kia ora
[1] Ref. geonet.org.nz
# 1. Magnitude 7.1, Saturday, September 4 2010 at 4:35 am (NZST), 40 km west of Christchurch
# 2. Magnitude 6.3, Tuesday, February 22 2011 at 12:51 pm (NZDT), 10 km south-east of Christchurch
# 3. Magnitude 6.3, Monday, June 13 2011 at 2:20 pm (NZST), 10 km east of Christchurch
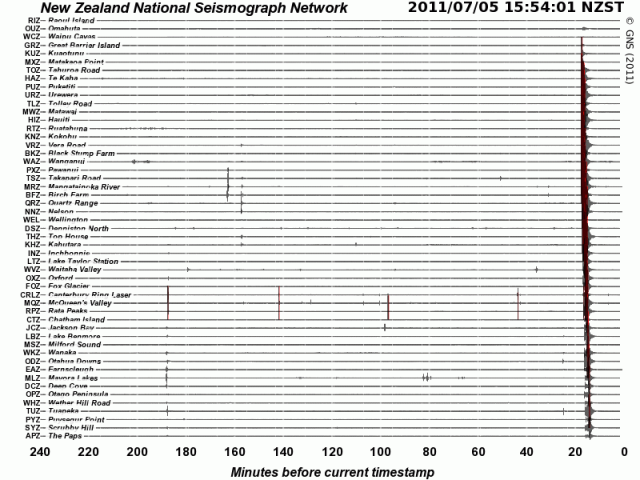
Bingo: Magnitude 6.5, Tuesday, July 5 2011 at 3:36 pm (NZST), 30 km west of Taupo
Unfortunately this ‘near miss’ for ChristChurch is not good news, for we share an integrated tectonic system and highly-connected local earthquake effects ..: Taupo 6.5 quake not good news 4 ChristChurch or NZ
Update 16 July 2011
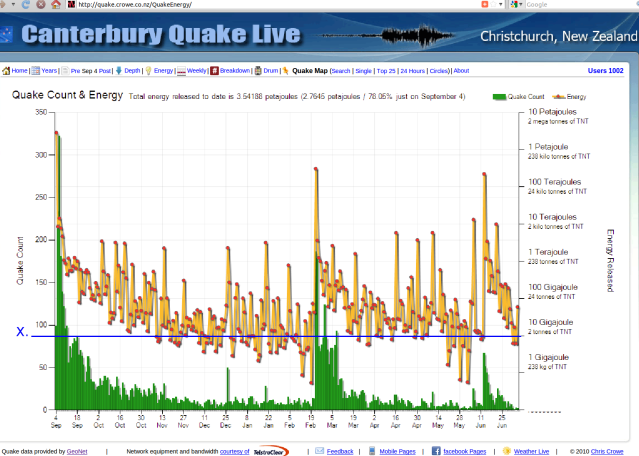
Very interesting how the Taupo magnitude 6.5 of July 5th reset the Canterbury seismicity level upwards for the following two weeks:
Point A shows the daily quake energy level that had declined, to the critical 10-Gigajoule mark “Line X” – until 5 July.
Point B shows how close we are to that aftershock decay level again now.

Can’t help wondering if the incredible amount of activity we’ve been seeing in the Darfield/Christchurch/Banks Peninsula region since September 4th last year might possibly be a sign that a new orogeny has started forming there. (Certainly, the general direction of the various faultlines involved aligns rather well with other major fault systems farther north.)
I agree that NZ earthquakes are somehow connected: Did anyone notice that for at least 5 days after both the February and June M 6.3 shocks in Christchurch, no earthquakes outside of central Canterbury were registered on the GeoNet website?
Hi Charles. Interesting comment. Do orogeny involve rifting usually, or what does drive them?
True, our big quake aftershocks just swamp the GeoNet Recent Quakes page, ‘taking up a lot of slack’ / redepositing a lot of ground-stress for quite some time. Understandable that that adjustment then allows more peripheral faults to get moving, and more behind them …
The geologists’ analysing of each single event, statistically in isolation, is simply not an holistic method. Add to that the ego we all have, but raised to a professional level, and it’s no wonder the unbelievable they say makes little sense to anyone else. Their system does add the best part of available facts though, we must not forget. Reconciling all available data as we go.. It would be easy to guess that the officials never share all that they know, however, which is an unhelpful approach to maintain. Cheers
Hi, just landed here (as a quake enthusiast from abroad, hope it does not sound too silly) while thinking about the amount of ‘total’ energy those currently active Canterbury faults may release. Is there any rough forecast or guess by anyone capable on how much energy is stored down there, i.e. what amount of sharp or less sharp jolts in total it might take for the beast to wear out? I mean in a way of ‘10000 3s or 10 4s plus 5000 3s or one 7.5 Richter’ or something similar?
obliged for any answer,
Martin
Hi Martin,
Sorry for delay. This is nearest estimation to that which you seek:
http://www.geonet.org.nz/canterbury-quakes/aftershocks/
I hope that helps precisely.
Kind regards
Rik
..Then of course we just had this, a few hundred kms north:
http://www.geonet.org.nz/earthquake/quakes/3598132g.html
http://quakes.globalincidentmap.com/map_detail.php?id=141169
a “7.5”, as you say.. but the next big terrestrial one is still due.