Tag Archive: 350.org


If the Labour Party is not elected to govern New Zealand today, it is because people want something different. ‘National light’ does not suffice. Those supporting National, or not supporting Labour, pay attention to ‘alternative facts’ and political spin. Bending the truth is significant about power, and Labour knows it. They have rebutted it, in the tax debate of September 2017, shining the torch away from their own record. Labour claimed much success, in the local elections of 2016, as evidence of a strong party ready to rise. From this they have gone on to pose as water-quality champions, by eliminating competition in that field. So let’s take a look at what they now propose to build upon in this area, veracity-wise.

Generation Zero rorting of polls in support of Labour-backed candidates is seen more and more every election, as economic crisis deepens, exemplified by the voter-defrauding chart produced here:


From GenZero’s http://www.localelections.nz/christchurch/environment-canterbury/ of 2016. – How is B+A=A higher than A+A=A, except as intentional lying? – ECan-paid contractor Pham then promoted candidate Pauling and split the vote for fourth place in Christchurch, allowing another already on the ECan payroll – Lowndes, zone committee chair – to secure it and become councillor. Lowndes broke election law by using an ECan logo on his campaign website, unrestrained. These were the Labour-backed candidates, professionally squeezing out grass-roots representation, slipping eyes past Labour’s high-pollution record and thoroughly foul conflicts of interest.

This was payback for 2007, when Save Our Water helped expose a Labour ECan councillor being paid to facilitate meetings for Central Plains Water, who then lost his seat. Ngai Tahu Iwi – intending corporate irrigator – lost its Labour seat at the same time (until National put it back, in May 2010).

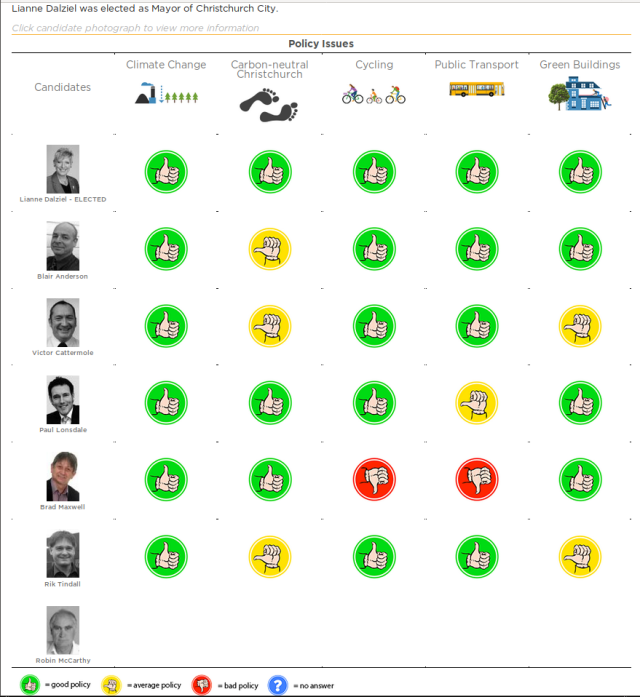
The same kind of dodgy rort by the same group was seen three years earlier, when they rated the Labour-based mayoral candidate, Lianne Dalziel, higher for carbon-friendly policies despite these being practically identical to at least one other candidate at the time. This was to completely ignore (and hide) Dalziel’s role in Helen Clark’s Labour government, that had heavily developed dairying, irrigation and greenhouse gas emissions in Canterbury during its decade in power. Generation Zero are thus exposed as intellectual and methodological frauds, ingratiating to relative power. Generation Zero are thus, in effect, corruptly right-wing too – just like the ‘me first’ Labour significant cult of the leader.

Generation Zero -Christchurch mayoral candidate evaluations -Oct13

Generation Zero – Christchurch mayoral candidate evaluations – October 2013

Dig into the Generation Zero fraud and what you find is, it is about attempting bigger fraud – that (consumer) transport emissions are ‘more important’ than industrial (agriculture, in New Zealand) emissions, that urban issues outweigh rural, that Auckland perspective will dominate the south. Of course Labour would want its apologists to say this, that (Auckland) city transport issues outweigh rural production – it is about shifting blame (and complete in-electability on this issue) off of Labour!

Generation Zero are understood and defined as a “public transport lobby group” by national news media (One News e.g.) out of Auckland influence – subordinating southern regional politics (of agricultural emissions reduction) to their own concern (urban transport planning). In 2017, new Labour then falsely took ownership of the water quality movement, with questionable policy proposals (tax water takes to fund river clean-up work, rather than transform the entire industry).

The ‘Generation Zero’ claim to be concerned for emissions reduction, to halt climate change, is belied by their actions. Totally. When they have the chance to stand against the National government, by endorsing the battle Save Our Water has brought to them since 2007, they walk away; they side with National’s decision to cut environmental democracy, that Save Our Water had represented for voters to Environment Canterbury (ECan). Instead, as the 2016 candidate rating chart shows, the Zeros back an ECan-paid consultant (staff) to replace public representation as somehow more suitable democratic voice – http://www.workingwaterstrust.org/who-are-we-.html director Pham. Professional resource-grabs – never public wishes – are what the Zeros are about. Their intervention is to eliminate emission-reduction proposals that Save Our Water has worked a decade for, from all decision debate. Generation Zero thus, by inter-dependency with reactionary Labour candidates, take climate action backwards!

Generation Fraud is what this is all really about: removing options and debate about resource conservation for the future generations, boiling everything down into the corporate one-or-two party choice; selling out the options of their own generation, by covering up Labour’s misuse of power, in reality. That is a offensively corrupt.

Right-wing frauds. If you are going to vote support for any of these people in September 2017, do so with your eyes wide open! The public elects representation on its own terms, not those of master manipulators.

View at Medium.com

Confirmed as divisive nonsense, through cover-ups by Labour Party adjuncts to corruptly nose them ahead in New Zealand elections, is that different generations of humans have separate material interests. Nothing could be more false. By fostering dishonesty, after their own style and career interests, New Zealand Labour does youth a massive disservice and so urgently needs to be exposed – to reduce the harm done by Labour influence immediately. Recruiting to their model corrupts and derails youth, against their own best interest, feeding the mental health crises. Over-emphasis on identity politics (anything for an extra vote) does this – distortion.

From this exposure of Labour deceit, political education can then progress, freed of the obfuscating market sleights imposed over decades by generations of corrupted Labour bureaucrats – for the sake of power.

The central, repetitive pitch of Labour leader Jacinda Adern in the TV1 main party leaders’ debate of 31-08-17, was that her generation lacked access to housing – given its inflated price relative to wages. While thin on detail over how they’d actual change this, and hiding the fact that years of Labour administration had only increased the disparity (from which multiple-home-owning Labour politicians always profit), housing security is an issue for every generation now. Vague dog-whistling, to gather attention for shifting power, is not an actual solution.

The destructive influence of Labour on youth wellbeing at community level has been further documented here:

https://riktindall.wordpress.com/2016/03/06/christchurch-south-youth-community-resilience-role-ccc-chch-preparedness-nz/ September 29, 2016 – Labour community board members killed off the proposal of a local youth council, to place Labour Youth members in charge of a dubious ‘Youth Community Board’ instead:
a. How totally corrupt!
b. What a sheer waste of wider democratic opportunity, for youth to become active in good local governance.

https://riktindall.wordpress.com/2016/10/14/nz-labour-just-lost-the-2017-election-nzlabour-christchurch-ecan-newzealand-water-nzpol-knzb-ccc/ October 14, 2016 – Labour lost the 2017 election one year earlier

The very worst of it is – beyond Labour’s corruption of aspiring youth to its evil gangster methods – is Labour corruption of local government staff in cementing its influence. They even go so far as having these staff falsify public records – community board minutes – to boost the optics of Labour effectiveness to the maximum level possible.

A Corrupt City Council, being CCC, is the shocking result: that the public can no longer trust its paid ‘servants’, under Labour instruction.

Labour in governance will do nothing except what enhances their power and status – one toxic, self-congratulating, self-promoting machine.

‘Dirty politics’ are not something different because they are Labour’s. A lot of warping effort, to disguise their record, for claiming agency over water quality standards. Theirs has been as great a contribution to pollution when in power, so they habitually lie to obscure this.

Substance before style, wins the day.
24.09.17 – The touted youthquake did not eventuate because, with opaque Labour self-interest, youth are neither silly nor blind: they knew they were being manipulated and not so many complied.

Jesinda at work?

Jesinda at work? – source: Darrien Fenton facebook

Democracy, warts and all. Backwards is worse. Explore ways to improve it. Have the vision – what is the route to survival for all? DJTrump/KJIll are rolling out the opposite direction … Frightening. So, what is the all-inclusive, sustainable development solution? Find it. Sell it. Win hearts to progress. (100% support would be the miracle)

[page under edit]

Invasion of the robot workers “Why aren’t the young in revolt? Why aren’t they out on the street biffing things? Perhaps they are about to.” July 12 2017
https://www.stuff.co.nz/technology/digital-living/94580089/invasion-of-the-robot-workers

Vernon Small: Labour may have tacked too close to National to spark voter ardour
https://www.stuff.co.nz/national/politics/opinion/94641918/vernon-small-labour-may-have-tacked-too-close-to-national-to-spark-voter-ardour July 13 2017

“New ways of utilising our land for economic gain that also have lower environmental footprints need to be found and adopted if we are to meet the vision New Zealanders have for their fresh waters.” http://www.stuff.co.nz/environment/91418638/top-scientist-fixing-freshwater-issues-an-enormous-challenge

NZ election 2017: Going beyond environmental slogans
https://www.stuff.co.nz/environment/95984894/nz-election-2017-going-beyond-environmental-slogans August 28 2017

Editorial: Water issues have boiled over
https://www.stuff.co.nz/national/politics/opinion/97044279/editorial-water-issues-have-boiled-over September 21 2017

POLITICAL ROUNDUP, Dr Bryce Edwards: Get ready for a Labour-NZ First government
https://www.nbr.co.nz/opinion/get-ready-labour-nz-first-government September 25 2017

https://www.facebook.com/rik.tindall/posts/10214991416085885 “The left, including New Zealand’s, can make no progress until it starts to understand that Labour is a right-wing party…” September 25 2017

Occupy Christchurch: In Our Own Words

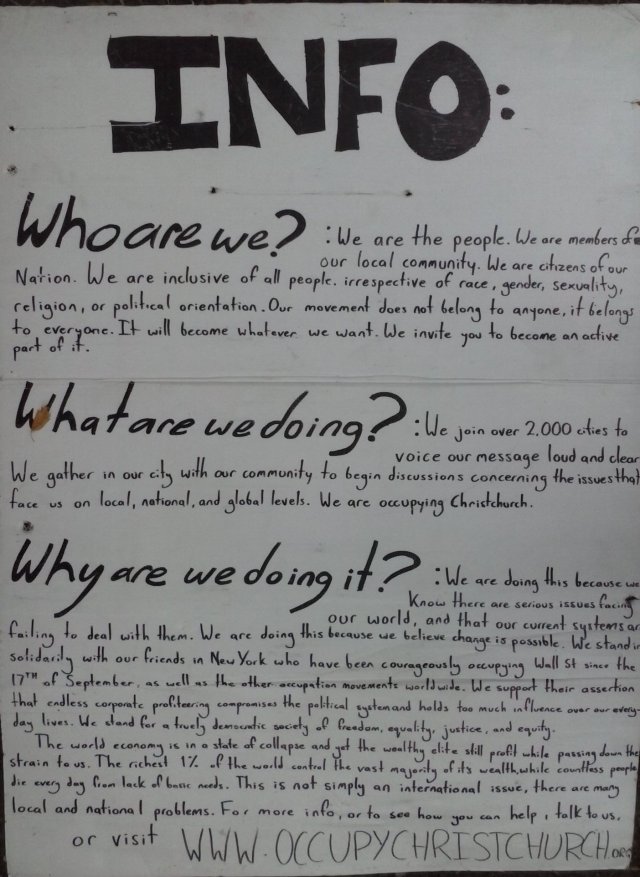
Occupy Christchurch, Information, Oct-2011

Occupy Christchurch, Information, October 2011

A lot of excellent oral history work by Byron Clark is soon to add to the written record of the late-2011-to-early-2012 Occupy movement moment in New Zealand. The content progress can be followed and listened to here: archive.org/details/OccupyChristchurch

Transcript for Kindle available online here:
goodreads.com/book/show/29745296-occupy-chirstchurch-in-our-own-words

Watch for a publication date here:
amazon.com/Occupy-Christchurch-Our-Own-Words-ebook/dp/B01DMEOV5U

Well done OChch and Byron! Thank you for all your efforts.

Here’s the project website: occupychristchurch.nz

I will next write a blog post inspired by reflection upon the collective Occupy Christchurch experience, as now expressed through Byron’s work. The aim is for this to become an informed philosophical and practical talk, to also be presented soon. We look forward to the book launch!

Kia ora. Kia kaha. Ka kite ano.

Update 6May16
Occupy ref. “Noam Chomsky on the death of the American Dream
Famed scholar, activist and political theorist Noam Chomsky talks frankly to Nine to Noon’s Katherine Ryan about politics, society and his new film, ‘Requiem for the American Dream’. Filmed over five years, the 87 year old unpacks the US policies of the past half-century which have lead to an unprecedented concentration of power in the hands of the select few. The documentary gets its New Zealand premiere at this years Documentary Edge International Film Festival It screens in Wellington today and on Sunday and in Auckland on Tuesday May 24th and Saturday May 28th.” radionz.co.nz/national/programmes/ninetonoon/audio/201799712/noam-chomsky-on-the-death-of-the-american-dream

Protest Is Broken’: Co-Creator of Occupy Wall Street Calls for New Mental Shift occupy.com/article/protest-broken-co-creator-occupy-wall-street-calls-new-mental-shift  “Occupy.. was a ‘constructive failure’” 2 July 2015 “..the main trigger for the next revolutionary movement will be a contagious mood that spreads throughout the world and the human community. For me, the main thing we need to see is activists abandoning a materialistic explanation of revolution – the idea that we need to put people in the streets – and starting to think about how to spread that kind of mood, how to make people see the world in fundamentally different way. That’s about it. The future of activism is not about pressing our politicians through synchronized public spectacles.. In the long run, it is much better to develop nonviolent tactics that allow you to create a stable and lasting social movement” – re new book:  The End of Protest: A New Playbook for Revolution by Micah White micahmwhite.com/the-end-of-protest-micah-white-phd 15 March 2016

Full credit to Kim Dotcom for getting the IMP waka moving, but the sooner he hands over his rudder the better. Kim’s hirelings are building a ‘representative’ structure per instruction, but will Kiwi people endorse them? Only if democratic norms prevail – something New Zealanders understand and value a lot.

Without rank-and-file input for where the Internet Party is going, it is bound to hit the rocks of reaction. So let’s stand up for what is right in representation and take the reins – should Kim be willing to pass them on.

Otherwise the negative publicity based on sound analysis will prevail and drag Internet Party followers down:

Octo-Kim - June 2014

Octo-Kim – June 2014

…… A bigger, more meaningful campaign than what has been proposed is required, to replace the National government in 2014. It must be good, just, open and fair. Let us get on with it. Stop the Internet Party write off

As the fog of environmental war descends upon Wellington, a nation’s capital, we are reminded that Earth punishes a degraded humanity; and that Earth’s forces were once known as God.[1]

Where evolution carries intelligence and democratic sharing of the greater tribe forward, contentious, divisive dull ego, that holds these back, is an abhorrence to nature – which has ways of starting over again. This is the lesson of ChristChurch, at the three-year anniversary of its commercial heart’s levelling. What sayeth that lesson?

#1. A cultural centre has shifted radically and its spire, the city’s icon, no longer stands over All.

Why? – The tale of an errant priest doth pertain:

Christchurch Cathedral, 22 February 2011

Christchurch Cathedral, 22 February 2011, set to meet its fate


This photograph, by Aranui’s Angela Thomas, surfaced on facebook on 17 January 2014. It is extraordinary, in that it was taken the night before large earthquake shattered the tranquil scene, on 22 February 2011 – three years ago. Rest In Peace those lost that day. Condolences to their families and friends. And great sympathy to the many and variously injured. Our story goes on. For generations to come.

This picture helps to decipher, to unpack and to understand, massive trauma.

For it clearly shows the shrine to Ba’al, created at the Cathedral’s doorstep, in the days before it fell to natural wrath. The wooded grove is the Biblical signature of such shrines to Ba’al, along with the bovine topiary statue. This signal cultural break – towards worship of Mammon – explains why heaven and earth didst protest, why ‘God’ hath rent this idyllic scene permanently.

The Dean of the church had been hailed in time, but scorned the Call greedily and foolishly. At Knox Church, on Bealey Avenue and Victoria Street corner, Dean Beck heard the following citation, during the local election forum of September 2007, from the Save Our Water campaign:

JEREMIAH 2,13 For my people have committed two evils; they have forsaken me[,] the fountain of living waters, [and] hewed them out cisterns, broken cisterns, that can hold no water.

This ancient quote referred to a good way of life, being lost as artificial storage for irrigation transforms the (Canterbury Plains) land into filth and damaging emissions: these form a travesty that cannot last.

The veracity of Save Our Water core was confirmed when the campaign’s main slogan – Keep Our Water Pure – kicked off a global meme of awareness, such as the cryptic and derivative New Zealand tourism “100% Pure” advertising. Authorities are yet to settle the environmental debt, however. And starting with Dean Beck, false pride needed to be put to one side, to validate the pure message of integrity – that everyone wants.

#2. We, the people, elected to Save Our Water – in Christchurch East (constituency of Environment Canterbury Regional Council) at least. No coincidence that the east, which includes the central city, should feel the brunt of social and economic loss, when democratic voice is denied.

For denied it was, by the 2008-201? National government, who swept the people’s clear wishes aside. In April 2010, National replaced the elected with hand-picked business and morally compromised voices. By September 2010, Earth rebellion had dramatically begun.

So how did our priest respond?

In winter 2010, Beck made pact with the politically compromised, not to Save Our Water but to promote Our Water Our Vote instead. A fair cry but a spoiler campaign, by a Labour-Green merger to monopolise progressive and environmental initiative, for controlling and centralising local election outcomes (upon Wellington, much like National). They too shut out and denied Save Our Water, ignoring the biblical Word.

That year Beck sank deeper in the moral mire of conflicted interest and political partisanship, when he chaired a mayoral candidate election forum, at the Catholic school in New Brighton. Selectively he ensured only incumbent Bob Parker and Labour candidate Jim Anderton were invited and made centre of aural attention. Shutting down alternatives corruptly this way, Beck was narrowing the pool to his own advantage.

By 2012 the purpose was clear, when Beck rode the change-wave into city council office in an east Christchurch by-election. But the talent of this pool was then further proved wanting, as Beck retired, out of energy, come 2013. In the meantime he had extended his sinecure, nonetheless, to replace ChristChurch income lost to his conniving sin, that he had enjoined from National via Labour-Green – all rejecting Jeremiah and to Save Our Water. Shame on them.

It can be no surprise, in knowing this scripture, that Beck’s church was ripped out from under him. For he had been put on very clear notice, to act for Good and not a false god.

Save Our Water launch 2007

Save Our Water launch, winter 2007

Save Our Water launch 2007

Save Our Water launch, winter 2007

Where some have mistaken Save Our Water for an economic injunction, it is actually a spiritual one – to bring us onside with universal All. ~ Rock met rock and our whole world shook, turning us upside down..

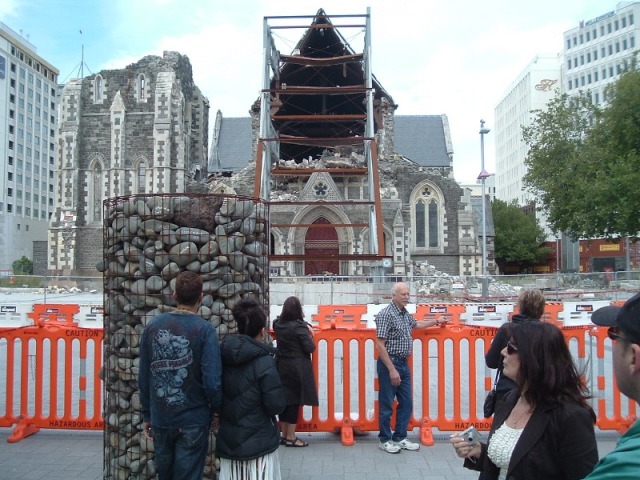
Christchurch Cathedral 2012 and Water Protest Cairn 2010

Christchurch Cathedral 2011 and water protest cairn, of winter 2010


Chch Cathedral and Cairn 2012

Christchurch Cathedral 2011 and water protest cairn, of winter 2010

#3. Peter Beck’s sin of hypocrisy and false witness rests in fronting Labour-Green’s city direction, built on Our Water Our Vote collusion to exclude Save Our Water, when it was Labour’s agribusiness developments that sucked Canterbury dry from the 1990s onwards.

Beck’s haughty rejection of Jeremiah’s warning, to pave his own entry into local politics, spelt rapid ruin for the church in his care. His Labour method of abuse of office to achieve higher status (electioneering with a dog-collar) was seen again this week with the forced exit of Shane Taurima from TVNZ. The reason that Labour-Green is ineffective opposition to National is their refusal to realise that they actually have to be different: non-corrupt.[2]

Only new thoughts and ways of doing things, justice and better democracy can put this city back together again, with identity integrity, because the old material way has most obviously failed. Make this city one body again, one church if you like, that Jesus could indeed be proud of. Or Mohammed, let praise be upon him equally, and any other fe/male prophet that may name. And never forget the downtrodden, the women and children amongst these. Amen.

[1] Fog lingers around Wellington Airport, 3 News, 20 Feb 2014

[2] TVNZ manager resigns over fundraising revelations, 3 News, 17 Feb 2014

Postscript: A loud “two evils” 22-2-2011 echo, from the heavens, when twin tornadoes straddled Christchurch the day after the anniversary’s passing, causing property damage, with one vortex crossing ‘Double-Corner Road’ in North Canterbury ~ http://www.radionz.co.nz/news/national/237042/civil-defence-checks-tornado-hit-houses ~ Forsooth. Forsaged, upon manifest Word. Let there Be cognizance!

And Justice: http://www.radionz.co.nz/news/regional/237120/engineer-to-review-ctv-info-for-police

Kia ora koutou. ‘Happy New Year’.

A lot could be said with still much omitted in summarising the many significant events of 2012 – cyclones Sandy and Evan etc, Syria and Palestine conflicts etc – so I won’t attempt more of one. Except to say that recent research findings indicate how humanity really must act, NOW, to achieve a stabilised higher level of civilisation; or else most likely perish in very great numbers as the resource shortages and energy effects of this industrial century compound and intensify.*

1. World on track for 6C warming without carbon cuts, study shows “consultancy giant PwC finds an unprecedented 5.1 per cent annual cut in global emissions per unit of GDP, known as carbon intensity, is needed through to 2050 if the world is to avoid the worst effects of climate change and meet an internationally agreed target of limiting average temperature increases to just two degrees above pre-industrial levels. Such deep reductions in carbon intensity would be over six times greater than the 0.8 per cent average annual cuts achieved since 2000. The report also confirms that greatest rises in greenhouse gas emissions came from the emerging E7 economies of China, India, Brazil, Mexico, Russia, Indonesia and Turkey, whose cumulative 7.4 per cent annual increase in emissions swamped record levels of reductions in the UK, France, and Germany” – guardian.co.uk/environment, 5 November 2012: so only animal capitalist competition is prevailing in the emissions reduction battle, with record climatic disasters.[1]

2. That is consistent with our collective past, which we must understand and strive to transcend –
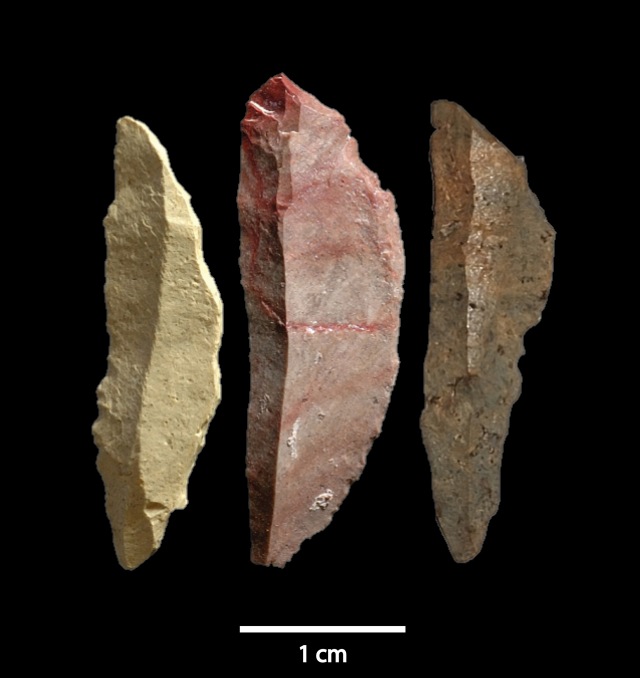
Oldest Arrowheads Hint at How Modern Humans Overtook Neandertals “Archaeologists excavating a cave on the southern coast of South Africa have recovered remains of the oldest known complex projectile weapons. The tiny stone blades, which were probably affixed to wooden shafts for use as arrows, date to 71,000 years ago and represent a sophisticated technological tradition that endured for thousands of years.. from a site called Pinnacle Point.. heat treatment of stone for 100,000 years.. the capacity for symbolic thinking arose in our common ancestor perhaps half a million years ago.. this projectile technology, which allows one to attack from a safe distance, would have given modern humans a significant edge during hunting and interpersonal conflict as they spread out of Africa into Europe and encountered the resident Neandertals equipped with handheld spears.. ‘if they were armed with the bow and arrow, they would have been more than a match for anything or anyone they met'” – blogs.scientificamerican.com, 7 November 2012.

Pinnacle arrow heads 2012

Pinnacle arrow heads 2012

Sibudu arrow heads 2010

Sibudu arrow heads 2010

Earlier, Oldest evidence of arrows found “excavated from layers of ancient sediment in Sibudu Cave in South Africa.. This is an indicator of a cognitively demanding behaviour.. Hunting with a bow and arrow requires intricate multi-staged planning, material collection and tool preparation and implies a range of innovative social and communication skills.. The discovery pushes back the development of ‘bow and arrow technology’ by at least 20,000 years.. modern humans in Africa 60,000 years ago had begun to hunt in a ‘new way’. Neanderthals and other early humans.. were likely to have been ‘ambush predators’, who needed to get close to their prey in order to dispatch them.. But the long gaps in the subsequent record of bows and arrows may mean that regular use of these weapons did not come until much later” BBC.co.uk/news, 26 Аugust 2010; & similar tellings of the story [2].

So the technologies of hunting and warfare have been integral to both human evolution and tribal survival for as long as our sub-species has been emerging. Could that ever change, such that permanent peace became possible? – Yes, but only through innovation of a conscious and dedicated super-tribal organisation, for the collective future. Let us get on with that urgent task.

Until these discoveries it was thought that “stone tools developed by our species Homo sapiens were no more sophisticated than those used by our extinct relatives the Neanderthals.. (Homo neanderthalensis) [who] appear in the fossil record about 400,000 years ago. At their peak, these squat, physically powerful hunters dominated a wide area spanning Britain and Iberia in the west, Israel in the south and Siberia in the east. Meanwhile, Homo sapiens evolved in Africa, and displaced the Neanderthals after spreading into Europe about 40,000 years ago. The last known evidence of Neanderthals comes from Gibraltar and is dated to between 28,000 and 24,000 years ago” – ‘Complexity’ of Neanderthal tools – news.bbc.co.uk, 26 August 2008.

Pioneer man ‘was human, not an ape man’ “our ancestors first moved to Britain much earlier than was previously thought.. settlement found in Happisburgh is thought to be 800,000 years old, 100,000 years earlier than discoveries had suggested man had even arrived here” – when much colder, using flint cutting tools – news.bbc.co.uk, 8 July 2010.

“Humans (Homo sapiens) are primates of the family Hominidae, and the only extant species of the genus Homo. They originated in Africa, where they reached anatomical modernity about 200,000 years ago and began to exhibit full behavioral modernity around 50,000 years ago” – wikipedia.org/wiki/Human.

“Homo is the genus of great apes that includes modern humans and species closely related to them. The genus is estimated to be about 2.3 to 2.4 million years old, possibly having evolved from australopithecine ancestors, with the appearance of Homo habilis” – wikipedia.org/wiki/Homo.

“It is suggested that the ancestors of gorillas and chimpanzees became more specialised in climbing vertical tree trunks, using a bent hip and bent knee posture which matches the knuckle-walking posture they use for ground travel. This was due to climate changes around 11 to 12 million years ago that affected forests in East and Central Africa so that there were periods when openings prevented travel through the tree canopy, and at these times ancestral hominids could have adapted the upright walking behaviour for ground travel. Humans are closely related to these apes” – wikipedia.org/wiki/Australopithecus.

Thus the direct link between climate change and human rEvolution goes back a very long way. Let us make the most of circumstances, yet again.

With organised agriculture long capable of feeding everyone on Earth, arms for securing food are almost redundant – once we develop a world of trust and full production – whereas arms do govern food’s unequal distribution. As recession promises depression, though, is a re-run of 1939-1945 actually more likely? Industrial destructive capacity has increased at least ten-fold since the 1940s, however, so this is a fate we cannot contemplate allowing world community to entertain.

[1] Bureau says 2012 a year of climatic extremes “record rainfalls and dry spells” & Fire warnings issued ahead of heatwave – abc.net.au/news, 3 January 2013 + 2012 in review: Environment “science spelt out the unprecedented temperature records across the different continents.. record-breaking temperatures in Europe and nearly 15,000 daily temperature records across the US alone.. the United States has labelled 2012 its hottest so far.. alarm over an unprecedented melt of Arctic sea ice.. as governments across the globe continue the long and challenging path of negotiating a new treaty by 2015, the one thing scientists have confirmed is that man’s role in climate change is now ‘virtually certain'” 18 Dec 2012.*

[2] Archaeologists Find the World’s Oldest Arrowheads “While others were still hurling spears, these ancient people were felling prey with arrows” discovermagazine.com, 7 December 2008; Oldest arrowheads found in Africa upi.com/Science_News, 26 August 2010.

* Nature’s balance tilts back at mammalian over-population, with repeated climatic attacks on infrastructure supporting the inorganic food-chain: Weather forces farmers to dump milk & Bridge washout hits West Coast tourism “Fox Glacier businesses losing up to $10k a day.. Westport coal services will be out of action for at least a week while repairs to the weather-hit Buller Gorge track take place. KiwiRail said its railway line between Christchurch and Greymouth was also still closed, with all train services cancelled along the lines.” The Press 4/01/2013 after Rising rivers close South Island roads 2/01/2013 from Record-rain warnings for west and Alps 1/01/2013; just six months earlier Coast cows die in weather bomb “Hypothermia claims hundreds of cows” 12/06/2012 – the cruel and stupid bull mega-dairy industry is fated to recompense: Owner of starving herd ‘under financial pressure’ “Vets were forced to put down 150 starving cows and 30 calves after an inspector from the Primary Industries Ministry found a 900-cow dairy herd in a distressed state in the farming district near Lake Brunner. Another 60 cows able to be transported were taken to the freezing works. The rest of the herd were taken on by West Coast farmers and are expected to take a lot of nursing. The ministry is investigating the animal welfare case and while details have yet to be officially released, the property was overstocked.” 7/09/2012.

+ Review of “Catastrophism – The Apocalyptic Politics of Collapse and Rebirth ..the view that society is on the path to collapsing—ecologically, economically, and morally. For some catastrophists, a collapse would spur a rebirth and cleansing..” ZMagazine 2012, while USA sets itself up for.. civil war #two? Fill the pool with fish and stockpile the guns: Up to THREE MILLION ‘Preppers’ in the U.S. are prepared for for the end of the world DailyMail 11 February 2012

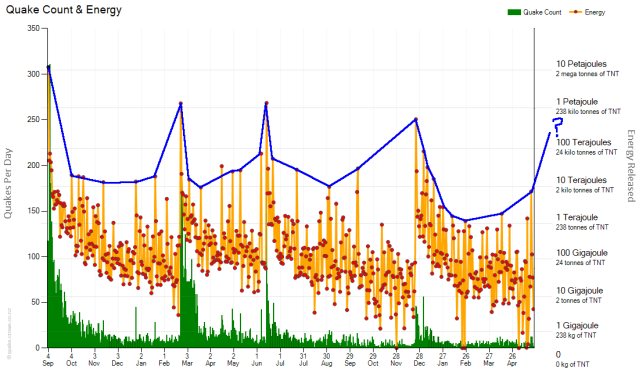
21 months of Christchurch earthquakes - Crowe.co.nz ChartEnergy 230512

21 months of Christchurch earthquakes – Crowe.co.nz ChartEnergy 230512


23 May forecast – This chart shows why we have certainty that Christchurch City’s next magnitude 5+ earthquake is imminent. The consistent U-shaped inter-quake curves trace what stage in the cycle of aftershock regeneration we are in.
Source: canterburyquakelive.co.nz/QuakeEnergy; thanks Chris Crowe for the base information display; interpretation Copyright © Rik Tindall 2012.

The fact that it takes a community volunteer to unearth important geological knowledge like this – with significant bearing upon community well-being – shows the utter negligent bankruptcy of National-ACT growth/austerity cowboy government ~ BRING CHANGE!

25 May update – The forecast 5+ earthquake did indeed arrive:
Magnitude 5.2, Friday, May 25 2012 at 2:44 pm (NZST), 10 km east of Christchurch.

Pegasus Bay magnitude 5.2 quake - GNS GeoNet.org.nz 250512

Pegasus Bay magnitude 5.2 quake – GNS GeoNet.org.nz 250512

Pegasus Bay mag 5.2 quake + 7 days of 3 up - Crowe.co.nz 250512

Pegasus Bay magnitude 5.2 earthquake + 7 days of mag 3 up – Crowe.co.nz 250512


“Magnitude: 5.23, Energy: 1 kilo tonne, Depth: 12.42 km, Address: In the water 10.9 KM from Scarborough” (Sumner – as forecast). Source: canterburyquakelive.co.nz

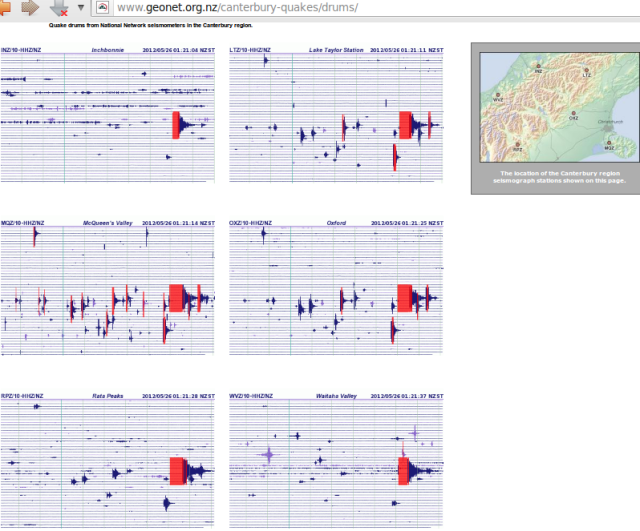
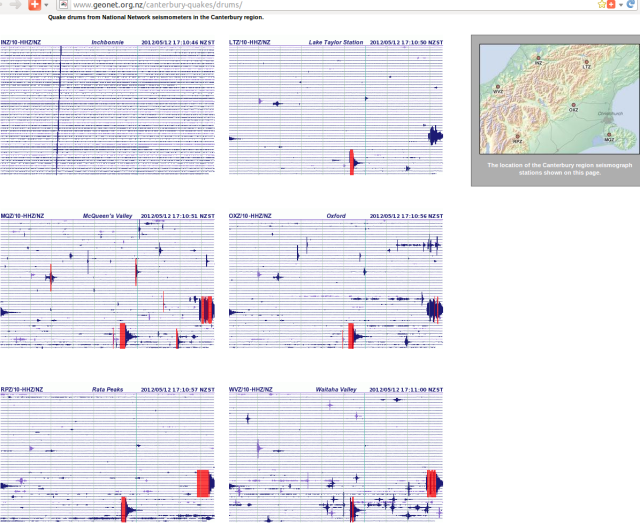
Pegasus Bay mag 5.2 quake - GNS Canterbury seismograph drums 250512

Pegasus Bay mag 5.2 quake – GNS Canterbury seismograph drums 250512

Source: geonet.org.nz/canterbury-quakes/drums

Pegasus Bay mag 5.2 quake context - GIM 250512

Pegasus Bay mag 5.2 quake context – GIM 250512

Source: quakes.globalincidentmap.com

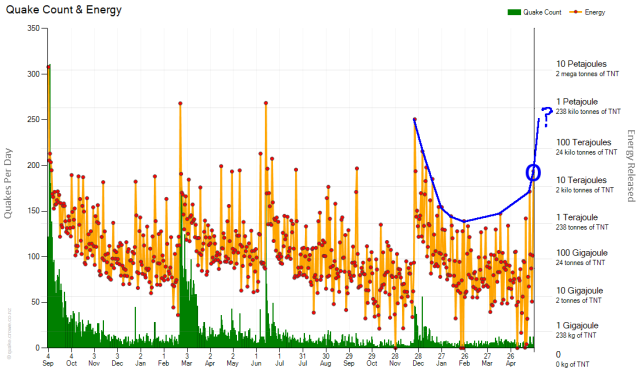
How the Energy Chart worked out, with new line plotted:

Pegasus Bay magnitude 5.2 quake - Crowe.co.nz ChartEnergy 250512

Pegasus Bay magnitude 5.2 quake (circled) – Crowe.co.nz ChartEnergy 250512

Source: canterburyquakelive.co.nz/QuakeEnergy

12 minutes before this 5.2 quake, 2:32 PM – 25 May 12 via web – @OurWaterOurCity tweet:
#NZ corporate fascist National cowboy government trades public #water assets 4 private & Canterbury #democracy 4 irrigation #Budget2012 #OWS

Magnitude 5.2 quake rocks Christchurch Fairfax NZ News 15:20 25/05/2012

ground truth has spoken

Realise all human potential and END WASTE.
Respect Earth environment and resurrect ONE LOVE.

Store note: Papers Past – Press – 21 August 1906 – Page 7 – A LOCAL PHENOMENON 15 Aug 1868 Valparaiso quake and tsunami waves recalled.

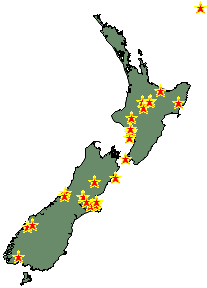
NZ recent Quakes - GNS 120512

NZ recent Quakes – GNS 120512

Now that is one ugly mess of subduction movement the length of Aotearoa!

Source: GeoNet.org.nz Recent New Zealand Earthquakes.

So what’s up?

A good way to keep aware – of anything these day – is Facebook. There you can read how last night I gave warning that today’s magnitude 5.5 and 3.9 quakes were on the way. To find out more, friend facebook.com/rik.tindall.

Looking forward to seeing you there 🙂

The North Island has risks even bigger than the South.

Kia kaha. Kia toa. Kia manawanui. Kia ora.

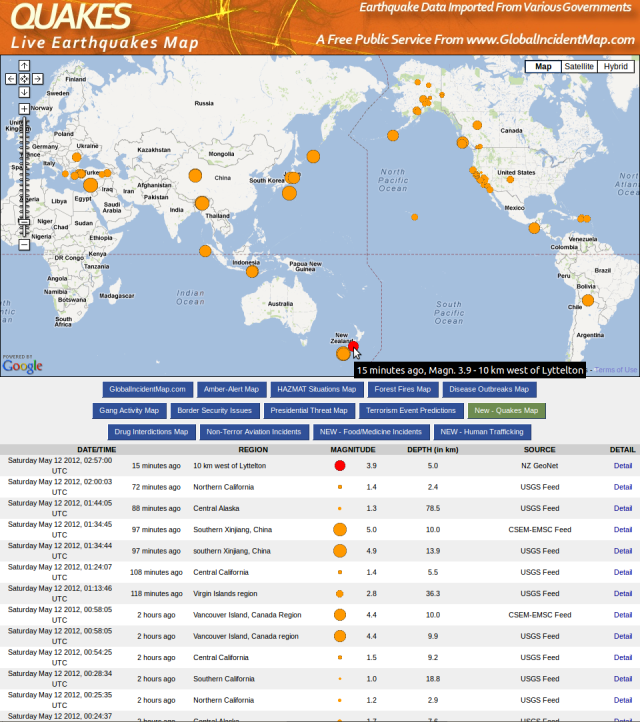
Tuatapere mag 5.5, Cashmere 3.9 - GIM 120512

Tuatapere mag 5.5, Cashmere 3.9 – GIM 120512


Source: quakes.globalincidentmap.com

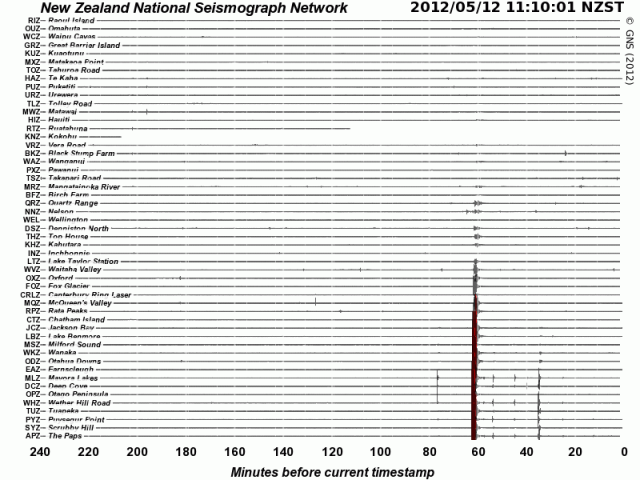
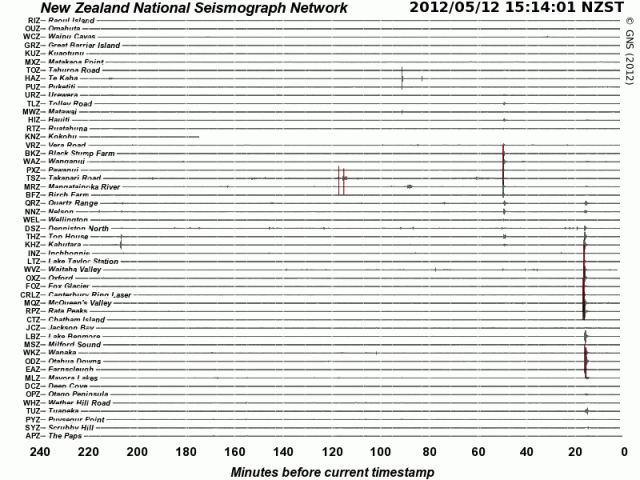
NZ deep south mag 5.5 quake - NSN 120512

NZ deep south mag 5.5 quake – NSN 120512


NZ Cashmere mag 3.9 quake - NSN 120512

NZ Cashmere mag 3.9 quake – NSN 120512

Source: geonet.org.nz/earthquake/drums

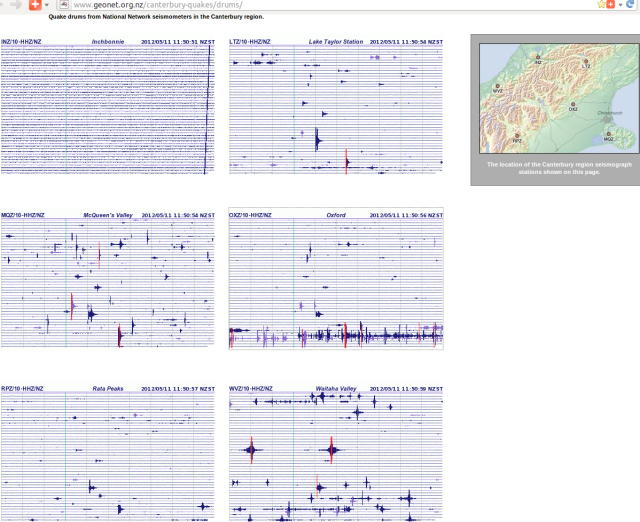
The give-away seismicity that enabled correct forecast of these magnitude 5.5 and ‘4’ approx events:

Mount Oxford jitters - GNS Canterbury Seismograph Drums 110512

Mount Oxford jitters – GNS Canterbury Seismograph Drums 110512


Source: geonet.org.nz/canterbury-quakes/drums/.
The magnitude 5.5 and 3.9 quakes as recorded in Canterbury:
Tuatapere mag 5.5, Cashmere 3.9 quakes - GNS Canterbury seismic Drums 120512

Tuatapere mag 5.5, Cashmere 3.9 quakes – GNS Canterbury seismic Drums 120512

And next there was the Tue, May 15 2012 1:27 pm Magnitude 4.5, Depth 11 km, 10 km north-east of Christchurch, confirming absolutely that correct indicators for upcoming Christchurch aftershocks have been discovered, in the September 4th 2010 earthquake wake.

A week later, again via Facebook, a forecast “4 towards 5?” was spot-on-time: Sun, May 20 2012 5:06 pm Magnitude 4.8, Depth 8 km, 20 km east of Christchurch, following a 9:35am 4.1.

magnitude 4.8 quake off Southshore - GNS 200512

magnitude 4.8 quake off Southshore – GNS 200512


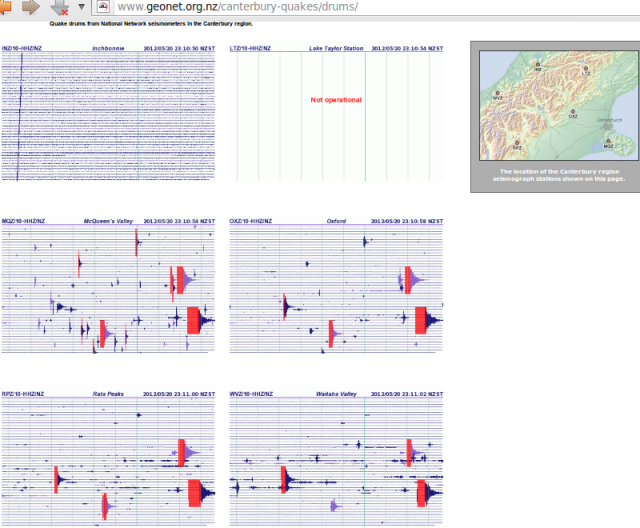
Christchurch magnitude 4.1, 4.8 quakes - GNS Canterbury seismograph drums 200512

Christchurch magnitude 4.1, 4.8 quakes – GNS Canterbury seismograph drums 200512

Protester Natalie - Christchurch Mail 7Mar12 p.2

Protester Natalie - Christchurch Mail 7Mar12 p.2


Occupy seek right to speak Christchurch Mail 7Mar12
Mayor Bob Parker not interested
Occupy Christchurch protestors say they want to convince the city council not to evict them from Hagley Park, but Mayor Bob Parker says he is not interested in what they have to say. A report is going before city councillors this month, when they will decide on whether legal action will be taken against the group. If they opt to issue a trespass notice, the camp will be given a timeframe to move on. Occupy protesters told the Mail they would be seeking speaking rights at the meeting. The council said it would advise protestors once a date was set.
The Occupy Christchurch protest was set up in October as part of a global movement to draw attention to corporate greed. However, police say it has attracted people with criminal convictions and drug and alcohol problems – in December police launched an investigation into the sexual assault of a 15-year-old woman at the site – and now the group is at odds with Christchurch Hospital. Hospital security workers have issued trespass notices to more than 25 Occupy protesters for allegedly leaving their toilets in a mess and behaving inappropriately or abusively towards staff, visitors and patients.
Mr Parker, who had wanted Occupy Christchurch gone before Christmas last year, said that he would most likely favour issuing protestors with a trespass notice. “If they don’t do that then it would be over to the police,” he said.
However, Christchurch central area commander Derek Erasmus said police would need a court order to remove the protesters. “You can’t trespass someone from a public place,” he said. The bylaw forbidding camping in a public place only carried an infringement notice, as a penalty Mr Erasmus said.
Councillor Yani Johanson said he could not say how he would vote but would like to hear from the protestors themselves. Council city environment manager Jane Parfitt said council staff would let the group know the date of the meeting so they could seek speaking rights. Mr Parker said it was not important that the protesters speak to the council and that what ever they had to say was irrelevant. He said everyone knew what they were demonstrating about as it had been widely reported in the media. The protesters had never invited him to come and talk to them, he said. “They have never invited me to go and I don’t think it’s that important that I go.”
Canterbury Distict Health Board (CDHB) general manager corporate services Murray Dickson said members of the group had […]
Ms Parfitt said the likely cost of legal action would be in the report going before councillors, but the figure had not been finalised. The Sunday Star Times reported attempts to move Occupy Auckland protesters out of Aotea Square cost Auckland ratepayers $356,587, which included the payment of $194,626 to legal firm Meredith Connell. The next biggest bill was security at $119,673 and the remaining $42,287 was spent on repairing damage. Mr Parker said he did not expect action against the Christchurch group to cost as much as it did in Auckland.

Previous post: Occupy Christchurch update 28 February 2012.

Protest camp behaviour should follow the Safer Spaces Policy for Occupy Christchurch/Ōtautahi:

Safe spaces are welcoming, engaging and supportive. A safe space is a space without violence, abuse or oppression.The aim of a safer spaces policy is to establish a process for dealing with situations where people become violent, abusive or otherwise display harmful behaviour towards others.

To build a conscientious and inclusive movement, we need to be aware of power structures that exist amongst us. We have no illusions that Occupy Christchurch Ōtautahi is free from all threats. By occupying this space, and participating in protest, we take risks. Though no space can ever be completely safe, we can still work towards creating an environment where people are encouraged to challenge – and feel both comfortable and supported with challenging – oppressive behaviour. In a safer space all allegations of abuse will be acted on and responded to. We want a culture that takes supporting people who have experienced abuse seriously.

In a safe space we need to . . .
* respect each others’ physical and emotional boundaries – take note of body language and what is said, and just as importantly, what is not said. Remember to gain active consent when engaging with people. If unsure, it is always better to ask.
* avoid using derogatory language or acting in a such a manner that objectifies or otherwise makes others feel uncomfortable or demoralised. Violence and harassment of any kind are not acceptable anywhere, and will not be tolerated here.
* be especially aware of our language and behaviour around children, and work to ensure that our space is welcoming, comfortable and safe for them.
* maintain a drug and alcohol free environment. This includes rejecting the participation of individuals under the influence of these substances.

Remember…
* that some people’s voices are louder than others. Be mindful of your own and others’ privilege and how much space you take up with your presence or voice.
* that some topics of discussion or situations trigger memories of abuse. Check in before discussing topics that might be triggering for others. For example, but not limited to, physical violence, sexual abuse, or encounters with police.
* don’t assume the person you are talking to feels safe enough to challenge your behaviour if it hurts or offends them. Gender, sexuality, familiarity with others present, ethnicity, age, class etc can affect how safe we feel.
* the pronouns and names of everyone. Again, do not assume anyone’s gender identity, sexual preference, economic status, background, health, etc.
* people sharing communal sleeping space have less privacy, need to change their clothes and may be sleeping. Please be particularly careful to respect each others’ privacy and any designated women-only sleeping space.

Strategy
* Individuals are responsible for articulating their own needs so that others have a chance to respond and remedy the situation. At all times people will endeavour to undertake conflict resolution with goodwill.
* People are encouraged to ask for help to address unhelpful behaviour in themselves or others. If you want support to confront oppressive behaviour, or need someone to listen, please ask for help from other occupiers.
* If you are called out for problematic behaviour, do not be defensive. Your intentions and character are not under attack, just the behaviour that is being challenged. Be open to understanding the role your behaviour has in other people’s experiences of oppression. Most people have experienced abuse of some sort and we want support to begin before abuse becomes public. We hope to be part of a community that is working to empower people and make them better able to respond to, challenge and defend themselves from abuse, before or after it happens. Supporting people around us is something that should happen at all times, not just following the discovery that a person has suffered abuse.
* Any group or individual engaging in violence (including physical, sexual, emotional/mental violence and harassment) within the Occupy Christchurch Ōtautahi movement cede their right to participate, and may be asked to leave.
* No alcohol, no drugs. These are our rules because they are the law, and we do not wish to do anything illegal to give the authorities an easy excuse to remove us. If you are found consuming drugs or alcohol at the occupation you will be asked to either stop or leave. If you see someone doing either of these at the occupation, please ask them to either stop or leave. People under the influence of drugs or alcohol may be asked to leave and not return until they are sober.

An off-site Occupy Christchurch General Assembly is to be held at WEA, 59 Gloucester St, Monday 12 March, at 7pm. All welcome to attend and discuss the above policy.

Agenda
* Karakia. Volunteer for minute taker and nominations for facilitator.
* Speaking order rules. Mihi/introductions round.
* Finalise agenda and order of items:
* Safer Spaces policy and Occupy Corner.
* Banning of undesirables from OChch and appeals process:
Occupy General Assembly has authority to bar destructive persons from its protest meetings, if unanimous.
An appeal of the ban is initiated by finding a mover and seconder to place review of decision on a GA agenda.
* That OChch accept Mayor Parker’s offer to meet with us by turning this into an invitation to the whole Council.
* That the proposed conference with Christchurch City Council shall be Monday 19 March at WEA.
* OChch camp security roster.
* OChch camp rubbish removal.
* Solidarity work for the Ports of Auckland struggle.
* Any other business.

Caution / clean-out of conspiracy theorists due: harm to the cause attributed. They have abandoned Occupy to run from the law and their own stupid choices.

Addenda:

Shaken city least fertile for Occupy crowd The Press 11/03/2012 Martin van Beynen
OPINION: Early on Wednesday I joined the mounting exodus to Australia. In search of a story rather than a better life, I hasten to add. One of the last sad sights I saw as I deserted the broken city was the rather pointless tent community in Hagley Park. I don’t regard the protest as much more than a bunch of freeloaders and deadbeats defiling an attractive and prominent section of parkland, but perhaps there is more to it. I know they are exercising their right to protest and I will die in a ditch for free speech but how long do they need to make their point? If they all went out and got a job, they could hire a billboard at a prominent intersection and disseminate their message much more effectively.
The Occupy movement has certainly made an impact around the world but it has struggled to persuade many in New Zealand. As a protest against vested interests and capitalism, it could choose better places than Christchurch where there are just not that many rich people and where an earthquake has shown no-one is immune to misfortune. Although the gap between the rich and poor is unquestionably widening in New Zealand, it still feels like a place where the work ethic is rewarded and the disadvantaged are provided with a modest living. Not exactly fertile ground for the Occupy Wall Street movement, which rails against a small group running things in favour of greed, consumption and profit while leaving ordinary people powerless to shape their society.
Across the ditch, however, there appears to be a real debate about the crisis in capitalism highlighted by the Occupy movement. From The Age and The Australian newspapers, it appears the local debate receives much of its impetus from the government’s carbon tax and the move to super- tax the profits of mining. Perhaps the Green Party’s mooting of a fund to fight coal developments in Queensland has something to do with it as well. Treasurer Wayne Swan has accused a bunch of “infamous billionaires” of mounting a “ferocious and misleading” campaign against the mining tax which prompted commentators in both papers to rush at varying speeds to the defence of capitalism. While it is simplistic to see the mining tax as a bid by the state to suck more out of the rich, from certain angles it certainly looks that way and many will be applauding from the sidelines.
Further on in The Age, as if to reinforce the point that the rich cannot be trusted, is coverage of a hearing in Melbourne this week which features an accountant who noticed the accounts of a company were missing at least $1.1 billion in short term debt but did not tell the board. With stories like this being revealed daily, you begin to see why people feel the pain is not being shared evenly. While it is easy to dismiss the limp Occupy protest in Christchurch and see the Australian situation as irrelevant to us, the issue certainly has traction further afield. The World Economic Forum at Davos this year proclaimed income disparity as the greatest risk during the next decade and even the Financial Times is running a series on the crisis within. It’s still hard to know whether the Occupy crowd are lamenting the usual powerlessness and struggle of the poor or whether their concerns also touch the middle class who have seen little improvement in their incomes in the last 10 years while costs of living have gone up steadily.
After the enlightenment gained from The Age and The Australian, I went to Vanity Fair for some light relief to find American economist Joseph Stiglitz also writing about the present angst. However he says the banking crisis brought on by the fecklessness of Wall Street and other financial centres is not the real cause of the present apparently never-ending slump. His theory is, that like the Depression of the 1930s, our current woes are due to a fundamental shift in the underlying economy of the West. He says our economies have shifted from manufacturing to services at an alarming rate due to technology and cheaper offshore labour pools. The shift, he says, has caused declines in income and jobs, although the inevitable crash was postponed by the bubble in the housing and lending markets. He believes governments need to embark on a massive investment programme to improve real productivity in the long run and “if we expect to maintain any semblance of normality we must fix the financial system”. Stiglitz laments the sort of society which pours money into a banking system without setting conditions or restrictions. “Americans are coming to understand what has happened. Protesters around the country, galvanised by the Occupy Wall Street movement, already know,” he writes.
I wonder if someone needs to tell the protesters in Hagley Park we have been sufficiently galvanised as well.

Longview, Occupy, and Beyond: Rank and File and the 89% Unite! recomposition.info/2012/03/11

Enemies Within: On Occupy and Infiltration, Part 1 Kasama project .org 29 February 2012 + Occupy Everything: Make the ripples, build for waves 21 November 2011

Picking up community debate, for better civic information and responses:

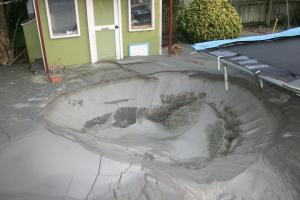
Sustainable Canterbury, Mauriroa Waitaha: 23 December 2011 earthquake aftermath #Parklands

Parklands liquefaction Hurst Place 130611 - Parklands Red-zone Action Group

Parklands liquefaction Hurst Place 130611 - Parklands Red-zone Action Group

More info: Search “December 23 quakes” stuff.co.nz

Here is the global seismic backdrop to earthquake series revival in Canterbury NZ. North-south, Alaska to Antarctica, warmed Earth crust is flexing. The tectonic pressure heaviest accumulated around the slow-moving Zealandia land mass, which is mostly submerged to Christchurch’s east and south, is increasingly expressing itself. Eventually, this mass too must move – with Pacific plate expansion, driving Alpine Fault rupture towards the south-west.

Here are the three largest offshore earthquake sites from 23 December, showing their alignment with a major south-west to north-east underground fracture fault that is the product of deep subduction trench activity to the north. Note also the coincidence of the 29-30 December aftershock upsurge, as on 23 December, with equivalent force events on the Kermadec trench.
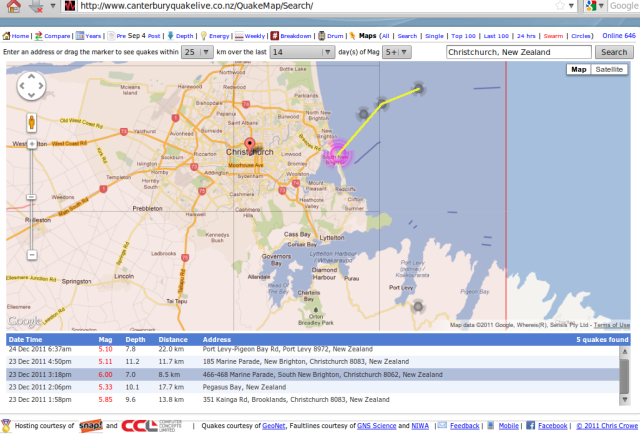
23 Dec 2011 big quakes alignment - L-R: 6.0, 5.8, 5.3 - Crowe.co.nz 311211

23 Dec 2011 big quakes alignment - L-R: mag' 6.0, 5.8, 5.3 - Crowe.co.nz 311211

Base graphic source: canterburyquakelive.co.nz/QuakeMap/Search/

Update – the latest magnitude 5.1 quake 1.27am NZDT also confirms this fault alignment:
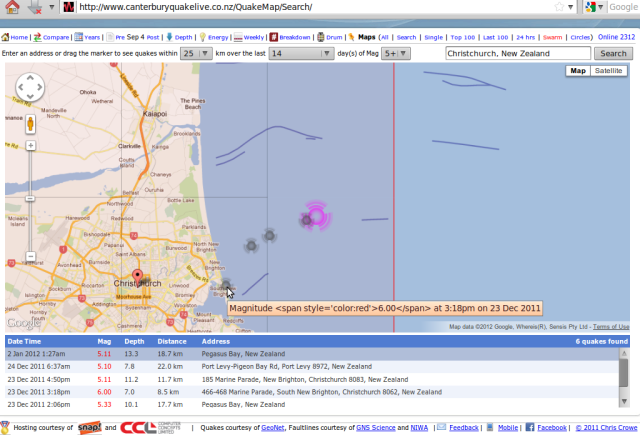
 020112 Pegasus Bay mag 5.1 quake, alignment to 23 Dec 6.0 etc - Crowe.co.nz

020112 Pegasus Bay mag 5.1 quake, alignment to 23 Dec 6.0 etc - Crowe.co.nz


According to Lack of aftershocks a good sign – expert diagram from The Press of 08/07/2011, we are now witnessing the direct extension of the Port Hills Fault. Will this eventually trigger something nearer to 7, on the newly-discovered offshore Kaiapoi Fault?
Christchurch faults - The Press 060711

Christchurch faults - The Press 060711

Theory confirmed – quakes have now reached Kaiapoi fault area … :
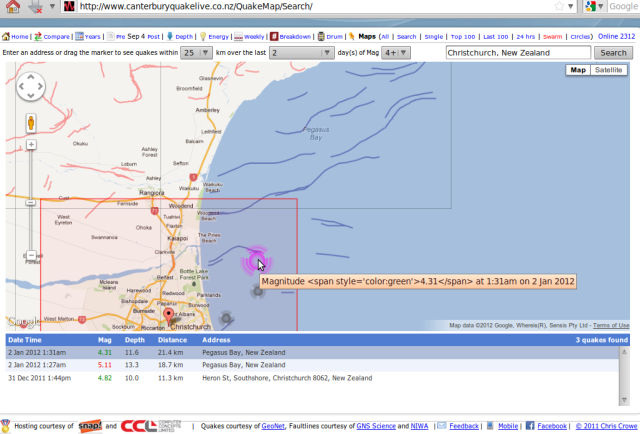
Pegasus Bay mag 5.1 quake, Kaiapoi 4.3 alignment - Crowe 020112

Pegasus Bay mag 5.1 quake, Kaiapoi 4.3 alignment - Crowe 020112


Update – the latest magnitude 5.4 quake 5:45am NZDT also confirms this fault alignment:
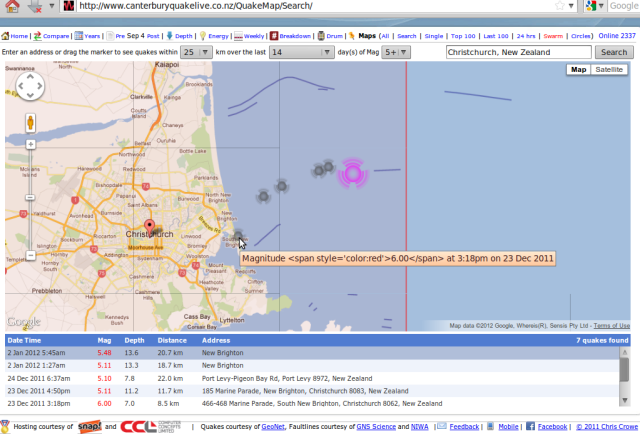
Pegasus Bay mag 5.4 quake - canterburyquakelive.co.nz 020112a

Pegasus Bay mag 5.4 quake - canterburyquakelive.co.nz 020112a

According to canterburyquakelive.co.nz and The Press Quake swarm rattles Christchurch, we just had “the 11th largest shake to hit the city” since 4 September 2010:
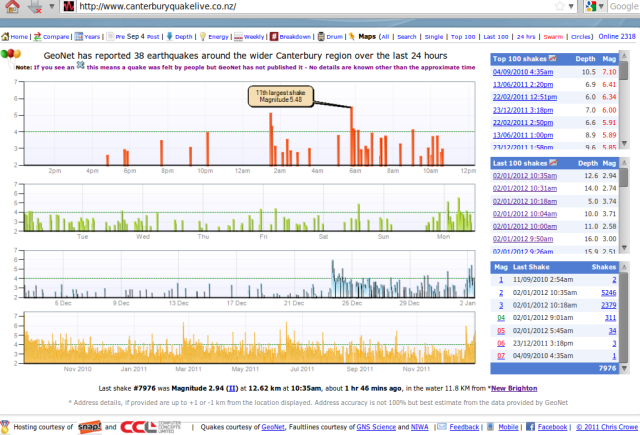
Pegasus Bay mag 5.4 quake history - Chris Crowe 020112c

Pegasus Bay mag 5.4 quake history - Chris Crowe 020112c

Note especially the increasing quake intensity at bottom right of these four charts.

Note: Shocks may be ‘last gasp’ of Feb 22 fault “this could be some residual activity from the eastern end of the February 22 fault that didn’t rupture all the way out there.. United States seismologist Kevin Furlong.. ‘what makes this a bit intriguing is that it has continued in such a systematic way for so long. I guess my arm-waving explanation is that the entire region was sufficiently stressed, and there were numerous fault segments, none of them particularly large, that were near failure conditions’ [! And?]” The Press 03/01/2012 + Shocks-could-trigger-exodus “those affected to maintain routines, communicate with friends and family, and seek help if needed” / GNS to give briefing on latest quakes + Earthquake woes set to intensify “Heading into 2012, many issues are set to intensify. Insurance wrangles, rising land prices and land zoning will be among contentious points as significant strides are expected to be made towards the region’s recovery. Of most concern is that about 3000 properties remain in limbo. The Canterbury Earthquake Recovery Authority has said the orange and white zones are ‘high priority’, and affected residents will be hoping for a belated Christmas present” 02/01/2012 + doubts over local science Aftershock may be one of biggest. More, refer to: [Canterbury Issues] #Chch leadership drought #NZ #CDEM

List from quakes.globalincidentmap.com (magnitude + km depth + data feed source):

Friday January 6 2012, 12:21:35 UTC South Island of New Zealand 4.5 9.9 USGS
Friday January 6 2012, 12:14:11 UTC Southern Alaska 2.9 101.1 USGS
Friday January 6 2012, 11:47:19 UTC Northern California 2.2 0.6 USGS
Friday January 6 2012, 11:29:43 UTC Northern California 1.5 2.9 USGS
Friday January 6 2012, 11:28:30 UTC Northern California 1.1 2.4 USGS
Friday January 6 2012, 11:24:40 UTC Southern Alaska 3.5 100.9 USGS
Friday January 6 2012, 10:49:33 UTC Northern California 2.6 0.2 USGS
Friday January 6 2012, 10:13:37 UTC Northern California 1.1 0.1 USGS
Friday January 6 2012, 09:04:04 UTC Island of Hawaii, Hawaii 2.0 1.5 USGS
Friday January 6 2012, 08:08:38 UTC off coast of Bio-Bio, Chile 5.0 15.2 USGS
Friday January 6 2012, 07:47:47 UTC Central California 1.2 8.0 USGS
Friday January 6 2012, 07:46:24 UTC Central California 1.3 0.0 USGS
Friday January 6 2012, 07:32:10 UTC Central California 1.1 8.1 USGS
Friday January 6 2012, 07:09:34 UTC Central California 1.2 8.1 USGS
Friday January 6 2012, 07:08:40 UTC Central California 2.1 6.6 USGS
Friday January 6 2012, 07:04:16 UTC South Island of New Zealand 4.7 11.3 USGS
Friday January 6 2012, 06:50:09 UTC Central California 3.3 7.3 USGS
Friday January 6 2012, 06:48:11 UTC Puerto Rico region 3.0 16.5 USGS
Friday January 6 2012, 06:37:20 UTC Mindoro, Philippines 4.8 169.8 USGS
Friday January 6 2012, 06:26:53 UTC Central California 2.8 6.5 USGS
Friday January 6 2012, 06:11:49 UTC northern Texas 2.0 4.9 USGS
Friday January 6 2012, 05:53:47 UTC Southern Alaska 2.9 13.2 USGS
Friday January 6 2012, 05:28:57 UTC Myanmar 4.4 54.1 USGS
Friday January 6 2012, 04:31:14 UTC New Ireland region, Papua New Guinea 4.8 80.4 USGS
[Update: pattern exactly as forecast – pix at bottom of page[1] – quake prediction service now temporarily suspended, while seeking a poll of support]

Friday January 6 2012, 04:23:16 UTC Central Alaska 2.6 104.9 USGS
Friday January 6 2012, 04:11:00 UTC off east coast North Island New Zealand 4.8 34.9 USGS
Friday January 6 2012, 04:02:47 UTC Oklahoma 2.8 2.9 USGS
Friday January 6 2012, 04:02:10 UTC Northern California 2.4 1.0 USGS
Friday January 6 2012, 03:58:49 UTC Southern Alaska 2.0 79.6 USGS
Friday January 6 2012, 02:47:50 UTC Southern California 3.1 6.9 USGS
Friday January 6 2012, 02:33:03 UTC Hawaii region, Hawaii 1.9 10.8 USGS
Friday January 6 2012, 02:14:08 UTC Santa Barbara Channel, California 3.0 7.5 USGS
Friday January 6 2012, 02:06:53 UTC Turkey-Syria-Iraq border region 4.3 4.5 USGS
Friday January 6 2012, 01:20:57 UTC South Island of New Zealand 4.5 8.4 USGS
Friday January 6 2012, 00:38:48 UTC southern Mid-Atlantic Ridge 5.1 10.0 USGS

Friday January 6 2012, 00:16:53 UTC eastern Turkey 4.6 10.0 USGS
Thursday January 5 2012, 23:52:48 UTC Virgin Islands region 3.0 35.0 USGS
Thursday January 5 2012, 23:28:44 UTC near east coast Honshu, Japan 4.9 22.0 USGS
Thursday January 5 2012, 23:14:48 UTC Kepulauan Batu, Indonesia 5.1 38.3 USGS
Thursday January 5 2012, 22:22:42 UTC offshore Baja California Sur, Mexico 4.3 15.0 USGS
Thursday January 5 2012, 22:02:40 UTC Dominican Republic 4.6 60.7 USGS
Thursday January 5 2012, 22:02:38 UTC Dominican Republic 4.0 20.0 USGS
Thursday January 5 2012, 21:55:22 UTC Pacific-Antarctic Ridge 5.2 15.9 USGS
Thursday January 5 2012, 20:55:47 UTC near east coast Honshu, Japan 5.0 45.5 USGS
Thursday January 5 2012, 20:30:53 UTC Central Alaska 2.2 123.7 USGS
Thursday January 5 2012, 19:49:43 UTC Utah 2.8 9.6 USGS
Thursday January 5 2012, 19:42:23 UTC Central Alaska 2.1 88.7 USGS
Thursday January 5 2012, 18:58:23 UTC Fox Islands, Aleutian Islands, Alaska 4.0 39.8 USGS
Thursday January 5 2012, 17:28:28 UTC Central California 2.0 10.5 USGS
Thursday January 5 2012, 17:18:14 UTC Central California 1.1 3.9 USGS
Thursday January 5 2012, 16:53:39 UTC southern Iran 5.0 32.5 USGS
Thursday January 5 2012, 16:47:05 UTC near the east coast of Honshu, Japan 5.1 20.1 USGS
Thursday January 5 2012, 16:29:28 UTC Southern Alaska 2.2 27.3 USGS
Thursday January 5 2012, 16:26:27 UTC Tonga 4.5 197.6 USGS
Thursday January 5 2012, 16:25:40 UTC Northern California 2.0 8.9 USGS
Thursday January 5 2012, 16:07:09 UTC Southern California 2.0 7.7 USGS
Thursday January 5 2012, 16:00:49 UTC Alabama 2.9 7.6 USGS
Thursday January 5 2012, 16:00:48 UTC Alabama 2.9 1.0 USGS
Thursday January 5 2012, 15:24:13 UTC Puerto Rico region 3.9 112.0 USGS
Thursday January 5 2012, 14:05:04 UTC Central California 1.9 4.8 USGS
Thursday January 5 2012, 13:52:29 UTC Central California 2.1 9.8 USGS
Thursday January 5 2012, 13:51:54 UTC Island of Hawaii, Hawaii 2.7 6.6 USGS
Thursday January 5 2012, 13:45:23 UTC Alaska Peninsula 2.6 5.6 USGS
Thursday January 5 2012, 13:05:24 UTC Southern Alaska 2.0 37.7 USGS
Thursday January 5 2012, 12:51:35 UTC Southern Alaska 2.1 109.2 USGS
Thursday January 5 2012, 12:27:57 UTC Central Alaska 2.1 0.0 USGS
Thursday January 5 2012, 12:16:40 UTC Central California 3.0 10.4 USGS
Thursday January 5 2012, 10:15:12 UTC western Montana 2.4 11.7 USGS
Thursday January 5 2012, 10:15:12 UTC western Montana 1.7 5.6 USGS
Thursday January 5 2012, 09:35:29 UTC Dominican Republic 5.3 10.0 USGS
Thursday January 5 2012, 09:15:34 UTC offshore Guatemala 4.4 66.1 USGS
Thursday January 5 2012, 09:14:41 UTC Southeastern Alaska 2.6 2.0 USGS
Thursday January 5 2012, 09:00:03 UTC Southern California 2.6 2.1 USGS
Thursday January 5 2012, 08:51:29 UTC Central California 1.1 4.0 USGS
Thursday January 5 2012, 07:56:37 UTC Crete, Greece 4.5 41.1 USGS
Thursday January 5 2012, 07:34:00 UTC Southern Alaska 2.0 16.8 USGS
Thursday January 5 2012, 07:20:10 UTC southern Idaho 3.4 4.9 USGS
Thursday January 5 2012, 06:10:18 UTC Northern California 2.1 18.4 USGS
Thursday January 5 2012, 06:10:18 UTC Northern California 1.9 18.3 USGS
Thursday January 5 2012, 06:03:06 UTC Northern California 1.0 1.2 USGS
Thursday January 5 2012, 04:48:32 UTC Kenai Peninsula, Alaska 2.3 78.7 USGS
Thursday January 5 2012, 04:37:43 UTC Central Alaska 2.2 107.0 USGS
Thursday January 5 2012, 04:08:04 UTC Southern Alaska 2.0 23.9 USGS
Thursday January 5 2012, 02:08:59 UTC Central California 2.1 8.0 USGS
Thursday January 5 2012, 01:19:55 UTC Sulawesi, Indonesia 4.8 97.0 USGS

[Update: 4.8 quake strikes Christchurch “tremor struck at 8.28am and was 15 kilometres deep and 10km east of the city.. centred in Pegasus Bay, where numerous quakes have been centred since the swarm on December 23” stuff.co.nz 08:45 05/01/2012 NZDT – expect more 5+ Antarctic plate rim quakes south of NZ, then rising Chch aftershocks again soon after those..]
Wednesday January 4 2012, 20:10:19 UTC Central Alaska 2.2 0.0 USGS
Wednesday January 4 2012, 19:53:36 UTC Santa Cruz Islands 5.1 43.2 USGS
Wednesday January 4 2012, 18:57:00 UTC Santa Cruz Islands 5.2 101.6 USGS

Wednesday January 4 2012, 18:30:58 UTC Southern California 2.1 6.7 USGS
Wednesday January 4 2012, 18:29:43 UTC Southern California 1.2 30.8 USGS
Wednesday January 4 2012, 18:25:42 UTC Southern California 2.2 5.5 USGS
Wednesday January 4 2012, 18:18:45 UTC Central California 1.4 9.9 USGS
Wednesday January 4 2012, 18:14:24 UTC near the north coast of New Guinea, Papua New Guinea 4.7 122.5 USGS
Wednesday January 4 2012, 18:04:30 UTC Tonga region 4.9 20.5 USGS [ = the current quake energy focus.. south-west Pacific, moving east]

Wednesday January 4 2012, 17:24:31 UTC Southern Alaska 3.8 135.6 USGS
Wednesday January 4 2012, 16:51:43 UTC Pakistan 4.8 10.0 USGS
Wednesday January 4 2012, 16:31:29 UTC southwestern Kashmir 4.2 40.5 USGS
Wednesday January 4 2012, 16:25:37 UTC Southeastern Alaska 4.3 17.8 USGS
Wednesday January 4 2012, 16:25:36 UTC British Columbia, Canada 4.3 7.0 USGS
Wednesday January 4 2012, 16:25:35 UTC Canada 4.4 92.0 Natural Resources Canada
Wednesday January 4 2012, 16:25:35 UTC Canada 4.2 90.0 Natural Resources Canada
Wednesday January 4 2012, 16:15:32 UTC Southern Yukon Territory, Canada 2.0 17.8 USGS
Wednesday January 4 2012, 16:12:53 UTC Central Alaska 2.5 36.4 USGS
Wednesday January 4 2012, 16:01:46 UTC Washington 2.4 0.8 USGS
Wednesday January 4 2012, 15:35:51 UTC Kepulauan Barat Daya, Indonesia 5.2 149.9 USGS
Wednesday January 4 2012, 15:12:26 UTC Puerto Rico region 2.6 15.3 USGS
Wednesday January 4 2012, 14:30:16 UTC Central Alaska 2.0 95.1 USGS
Wednesday January 4 2012, 14:30:16 UTC Central Alaska 2.1 95.3 USGS
Wednesday January 4 2012, 14:21:21 UTC Izu Islands, Japan region 4.7 407.3 USGS
Wednesday January 4 2012, 13:56:17 UTC Puerto Rico 2.1 6.0 USGS
Wednesday January 4 2012, 13:45:06 UTC Central Alaska 2.4 13.0 USG
Wednesday January 4 2012, 13:08:11 UTC southwestern Siberia, Russia 4.7 10.0 USG
Wednesday January 4 2012, 12:43:30 UTC Northern California 2.1 2.6 USGS
Wednesday January 4 2012, 11:49:40 UTC Mona Passage, Puerto Rico 2.7 11.0 USGS
Wednesday January 4 2012, 11:07:20 UTC Central Alaska 2.4 12.7 USGS
Wednesday January 4 2012, 11:07:21 UTC Central Alaska 2.1 18.1 USGS
Wednesday January 4 2012, 10:57:32 UTC Northern California 1.9 1.9 USGS
Wednesday January 4 2012, 09:22:13 UTC Virgin Islands region 3.1 126.0 USGS [ = the current quake energy focus.. south-Central Pacific, moving south]
Wednesday January 4 2012, 08:41:37 UTC Puerto Rico region 3.4 75.9 USGS
Wednesday January 4 2012, 06:59:57 UTC Taiwan 4.4 11.5 USGS
Wednesday January 4 2012, 06:48:06 UTC Central Alaska 2.0 13.5 USGS
Wednesday January 4 2012, 06:47:21 UTC Baja California, Mexico 2.8 6.5 USGS
Wednesday January 4 2012, 06:28:33 UTC Southern California 2.2 13.9 USGS
Wednesday January 4 2012, 06:25:12 UTC Northern California 2.8 3.0 USGS
Wednesday January 4 2012, 06:22:34 UTC Northern California 1.2 3.1 USGS
Wednesday January 4 2012, 06:16:54 UTC Southern Alaska 2.0 23.1 USGS
Wednesday January 4 2012, 05:57:45 UTC Southeastern Alaska 2.3 0.1 USGS
Wednesday January 4 2012, 04:47:35 UTC Vanuatu 5.2 233.1 USGS
Wednesday January 4 2012, 04:41:06 UTC south of Sumba, Indonesia 4.8 26.9 USGS
Wednesday January 4 2012, 04:32:18 UTC Island of Hawaii, Hawaii 1.7 10.4 USGS
Wednesday January 4 2012, 04:20:49 UTC Unimak Island region, Alaska 2.7 41.9 USGS
Wednesday January 4 2012, 03:58:51 UTC Southern California 1.4 8.9 USGS
Wednesday January 4 2012, 03:53:40 UTC Southern California 2.0 10.9 USGS
Wednesday January 4 2012, 03:38:56 UTC Southern California 1.6 7.4 USGS
Wednesday January 4 2012, 02:35:12 UTC Island of Hawaii, Hawaii 1.7 6.2 USGS
Wednesday January 4 2012, 02:07:52 UTC Ryukyu Islands, Japan 4.9 21.9 USGS
Wednesday January 4 2012, 01:49:13 UTC Bonin Islands, Japan region 4.8 9.3 USGS [ = the current quake energy focus.. north-Central Pacific, moving south]

Wednesday January 4 2012, 00:26:01 UTC Southern Alaska 3.9 136.8 USGS
Tuesday January 3 2012, 23:35:57 UTC Island of Hawaii, Hawaii 2.4 6.9 USGS
Tuesday January 3 2012, 22:03:16 UTC British Columbia, Canada 2.1 0.0 USGS
Tuesday January 3 2012, 21:50:27 UTC offshore Bio-Bio, Chile 4.6 32.6 USGS
Tuesday January 3 2012, 21:32:37 UTC Puerto Rico region 3.2 51.5 USGS
Tuesday January 3 2012, 21:12:48 UTC San Francisco Bay area, California 2.2 10.6 USGS
Tuesday January 3 2012, 21:00:26 UTC Island of Hawaii, Hawaii 1.8 6.2 USGS
Tuesday January 3 2012, 18:29:13 UTC Puerto Rico region 2.5 11.0 USGS
Tuesday January 3 2012, 18:11:00 UTC Unimak Island region, Alaska 2.4 41.5 USGS
Tuesday January 3 2012, 17:55:33 UTC Nevada 2.3 13.7 USGS
Tuesday January 3 2012, 15:40:02 UTC Guam region 5.2 35.5 USGS
Tuesday January 3 2012, 14:18:56 UTC Channel Islands region, California 4.1 18.4 USGS
Tuesday January 3 2012, 13:32:54 UTC Hawaii region, Hawaii 3.7 44.5 USGS
Tuesday January 3 2012, 13:32:56 UTC Hawaii region, Hawaii 3.4 15.5 USGS
Tuesday January 3 2012, 13:02:39 UTC Central Alaska 1.8 0.4 USGS
Tuesday January 3 2012, 12:20:17 UTC Kuril Islands 4.9 43.5 USGS
Tuesday January 3 2012, 10:56:57 UTC Oklahoma 3.2 4.9 USGS
Tuesday January 3 2012, 08:41:37 UTC Fox Islands, Aleutian Islands, Alaska 4.5 99.8 USGS
Tuesday January 3 2012, 07:57:31 UTC Central Alaska 1.5 7.4 USGS
Tuesday January 3 2012, 07:40:01 UTC southern Xinjiang, China 4.5 44.2 USGS
Tuesday January 3 2012, 07:20:49 UTC Central Alaska 2.1 94.0 USGS
Tuesday January 3 2012, 07:13:31 UTC Central Alaska 1.5 115.8 USGS
Tuesday January 3 2012, 07:10:54 UTC Southern Alaska 2.4 24.5 USGS
Tuesday January 3 2012, 07:10:44 UTC Northern California 2.4 2.8 USGS
Tuesday January 3 2012, 06:09:48 UTC Fox Islands, Aleutian Islands, Alaska 2.8 24.9 USGS
Tuesday January 3 2012, 05:46:52 UTC south of Alaska 3.0 29.5 USGS [= the current quake energy focus.. North Pacific]
Tuesday January 3 2012, 04:02:00 UTC Central Alaska 2.4 74.8 USGS
Tuesday January 3 2012, 03:29:06 UTC San Pedro Channel, California 2.2 0.1 USGS
Tuesday January 3 2012, 03:16:33 UTC Greater Los Angeles area, California 2.0 13.0 USGS
Tuesday January 3 2012, 03:06:24 UTC Alaska Peninsula 3.8 46.9 USGS
Tuesday January 3 2012, 02:58:51 UTC Central Alaska 2.6 16.0 USGS
Tuesday January 3 2012, 02:11:33 UTC Southern California 2.0 2.4 USGS
Tuesday January 3 2012, 01:30:57 UTC Baja California, Mexico 2.9 12.2 USGS
Tuesday January 3 2012, 00:42:13 UTC British Columbia, Canada 2.1 0.0 USGS
Tuesday January 3 2012, 00:20:29 UTC Central Alaska 2.0 14.7 USGS
Monday January 2 2012, 22:04:57 UTC Nevada 1.9 4.8 USGS
Monday January 2 2012, 22:02:09 UTC Island of Hawaii, Hawaii 1.8 6.3 USGS
Monday January 2 2012, 21:56:58 UTC Nevada 1.8 0.1 USGS
Monday January 2 2012, 21:31:11 UTC Gulf of Alaska 3.3 10.9 USGS
Monday January 2 2012, 21:15:46 UTC Island of Hawaii, Hawaii 2.4 4.9 USGS
Monday January 2 2012, 19:14:10 UTC Kodiak Island region, Alaska 2.3 13.2 USGS
Monday January 2 2012, 18:15:53 UTC Central Alaska 2.0 9.9 USGS
Monday January 2 2012, 17:08:50 UTC Northern California 1.0 2.2 USGS
Monday January 2 2012, 16:41:26 UTC Northern California 1.2 2.0 USGS
Monday January 2 2012, 16:30:31 UTC Northern California 2.1 6.3 USGS
Monday January 2 2012, 16:06:23 UTC Fox Islands, Aleutian Islands, Alaska 3.7 17.6 USGS
Monday January 2 2012, 16:04:21 UTC Northern California 1.7 2.4 USGS
Monday January 2 2012, 15:55:27 UTC Northern California 1.5 2.1 USGS
Monday January 2 2012, 15:54:43 UTC Northern California 3.0 2.4 USGS
Monday January 2 2012, 15:23:25 UTC Southern Alaska 2.6 44.7 USGS
Monday January 2 2012, 15:23:25 UTC Southern Alaska 2.7 40.3 USGS
Monday January 2 2012, 14:23:52 UTC Southern Alaska 2.5 107.0 USGS
Monday January 2 2012, 14:19:01 UTC Alaska Peninsula 1.8 1.3 USGS
Monday January 2 2012, 14:14:56 UTC Central Alaska 2.1 10.4 USGS
Monday January 2 2012, 13:21:23 UTC Central Alaska 3.2 15.0 USGS
Monday January 2 2012, 13:20:34 UTC Puerto Rico region 2.6 4.2 USGS
Monday January 2 2012, 13:10:29 UTC Virgin Islands region 3.3 12.0 USGS
Monday January 2 2012, 13:07:08 UTC New Ireland region, Papua New Guinea 4.7 10.0 USGS
Monday January 2 2012, 12:58:42 UTC Central California 1.8 3.8 USGS
Monday January 2 2012, 12:50:08 UTC Central Alaska 2.0 130.1 USGS
Monday January 2 2012, 12:45:21 UTC Central Alaska 1.7 5.4 USGS
Monday January 2 2012, 12:25:35 UTC Island of Hawaii, Hawaii 3.0 0.0 USGS
Monday January 2 2012, 11:53:26 UTC Virgin Islands region 3.0 52.0 USGS
Monday January 2 2012, 11:18:32 UTC Central California 1.4 5.5 USGS
Monday January 2 2012, 11:18:05 UTC Central California 2.1 4.0 USGS
Monday January 2 2012, 11:11:24 UTC Central Alaska 2.4 0.0 USGS
Monday January 2 2012, 11:08:46 UTC Southern Alaska 2.3 4.8 USGS
Monday January 2 2012, 10:42:01 UTC Virgin Islands region 2.9 61.0 USGS
Monday January 2 2012, 10:40:33 UTC Virgin Islands region 2.7 58.0 USGS
Monday January 2 2012, 10:32:28 UTC Unimak Island region, Alaska 2.1 9.3 USGS
Monday January 2 2012, 09:49:49 UTC Central Alaska 2.0 116.4 USGS
Monday January 2 2012, 09:39:57 UTC northern Mid-Atlantic Ridge 4.8 10.0 USGS
Monday January 2 2012, 08:55:12 UTC Rat Islands, Aleutian Islands, Alaska 4.9 89.6 USGS
Monday January 2 2012, 08:34:27 UTC Kenai Peninsula, Alaska 2.4 46.6 USGS
Monday January 2 2012, 08:27:59 UTC Kenai Peninsula, Alaska 1.8 93.7 USGS
Monday January 2 2012, 07:02:46 UTC offshore Northern California 2.8 16.3 USGS
Monday January 2 2012, 06:53:27 UTC Central California 2.2 4.0 USGS
Monday January 2 2012, 06:38:31 UTC Southern Alaska 2.7 71.5 USGS
Monday January 2 2012, 06:36:29 UTC Gulf of Santa Catalina, California 2.0 0.1 USGS
Monday January 2 2012, 05:59:14 UTC South Island of New Zealand 4.5 13.2 USGS
Monday January 2 2012, 05:24:23 UTC Northern California 1.9 2.3 USGS
Monday January 2 2012, 05:09:15 UTC Northern California 1.1 2.5 USGS
Monday January 2 2012, 04:58:38 UTC Central Alaska 3.0 152.8 USGS
Monday January 2 2012, 04:04:11 UTC Southern Alaska 2.4 90.7
Monday January 2 2012, 03:57:59 UTC Northern California 1.1 3.1 USGS
Monday January 2 2012, 03:25:31 UTC Northern California 1.5 2.7 USGS
Monday January 2 2012, 03:09:12 UTC Southern California 2.4 18.6 USGS
Monday January 2 2012, 01:30:32 UTC Southern Alaska 2.2 35.4 USGS
Monday January 2 2012, 01:29:05 UTC Alaska Peninsula 2.0 25.3 USGS
Monday January 2 2012, 00:52:56 UTC Central Alaska 2.0 13.6 USGS
Monday January 2 2012, 00:52:49 UTC Northern California 2.0 2.5 USGS
Monday January 2 2012, 00:16:09 UTC Southern California 1.6 2.8 USGS
Sunday January 1 2012, 23:57:21 UTC Romania 4.2 33.2 USGS
Sunday January 1 2012, 23:56:22 UTC Southern California 1.8 5.6 USGS
Sunday January 1 2012, 23:26:01 UTC Southern California 2.1 1.2 USGS
Sunday January 1 2012, 22:59:13 UTC Vanuatu 5.1 32.2 USGS
Sunday January 1 2012, 21:27:00 UTC Southern Alaska 2.3 14.7 USGS
Sunday January 1 2012, 21:07:28 UTC Halmahera, Indonesia 5.0 87.1 USGS
Sunday January 1 2012, 20:06:21 UTC Northern California 2.0 1.8 USGS
Sunday January 1 2012, 19:32:51 UTC Bougainville region, Papua New Guinea 4.9 146.0 USGS
Sunday January 1 2012, 19:14:43 UTC Central Alaska 2.5 123.1 USGS
Sunday January 1 2012, 18:16:17 UTC Utah 2.2 0.2 USGS
Sunday January 1 2012, 18:09:01 UTC northern Sumatra, Indonesia 5.3 1.0 USGS
Sunday January 1 2012, 17:22:08 UTC Central California 2.3 1.3 USGS
Sunday January 1 2012, 16:45:05 UTC South Island of New Zealand 5.0 19.4 USGS
Sunday January 1 2012, 15:57:06 UTC Puerto Rico region 2.6 4.1 USGS
Sunday January 1 2012, 15:47:36 UTC Northern California 2.2 3.6 USGS
Sunday January 1 2012, 15:45:52 UTC Northern California 1.6 5.4 USGS
Sunday January 1 2012, 15:44:15 UTC south of the Mariana Islands 5.1 22.2 USGS
Sunday January 1 2012, 14:59:30 UTC San Francisco Bay area, California 2.5 1.6 USGS
Sunday January 1 2012, 14:52:49 UTC Northern California 2.2 3.4 USGS
Sunday January 1 2012, 14:48:42 UTC south of Panama 4.4 10.1 USGS
Sunday January 1 2012, 14:28:08 UTC Central Alaska 2.2 0.0 USGS
Sunday January 1 2012, 13:32:20 UTC Southern Alaska 2.6 198.9 USG
Sunday January 1 2012, 13:32:20 UTC Southern Alaska 2.5 200.2 USGS
Sunday January 1 2012, 12:27:56 UTC South Island of New Zealand 5.0 13.8 USGS
Sunday January 1 2012, 11:59:05 UTC south of the Kermadec Islands 4.9 42.9 USGS

Sunday January 1 2012, 11:49:06 UTC Central California 2.0 9.2 USGS
Sunday January 1 2012, 11:30:20 UTC Central Alaska 2.3 0.0 USGS
Sunday January 1 2012, 09:29:48 UTC Southern California 2.1 8.6 USGS
Sunday January 1 2012, 09:29:43 UTC off east coast Honshu, Japan 4.7 10.0 USGS
Sunday January 1 2012, 09:29:48 UTC off east coast Honshu, Japan 4.6 45.7 USGS
Sunday January 1 2012, 09:29:48 UTC Southern California 2.1 8.6 USGS
Sunday January 1 2012, 08:53:49 UTC Southern California 2.2 7.4 USGS
Sunday January 1 2012, 08:31:26 UTC near the east coast of Honshu, Japan 4.5 43.1 USGS
Sunday January 1 2012, 08:29:44 UTC Island of Hawaii, Hawaii 1.7 32.5 USGS
Sunday January 1 2012, 07:40:27 UTC offshore Guatemala 4.3 71.5 USGS
Sunday January 1 2012, 06:52:17 UTC Mona Passage, Puerto Rico 3.0 17.0 USGS
Sunday January 1 2012, 05:48:29 UTC Central Alaska 2.3 22.7 USGS
Sunday January 1 2012, 05:27:54 UTC Izu Islands, Japan region 6.8 348.5 USGS
Sunday January 1 2012, 05:19:39 UTC Andaman Islands, India region 4.6 31.8 USGS
Sunday January 1 2012, 04:56:41 UTC Pacific-Antarctic Ridge 5.1 10.0 USGS
Sunday January 1 2012, 04:39:21 UTC Southern Alaska 2.0 24.0 USGS
Sunday January 1 2012, 02:40:36 UTC northern Colombia 4.0 158.1 USGS
Sunday January 1 2012, 02:35:19 UTC Tripura, India region 4.6 15.2 USGS
Sunday January 1 2012, 01:02:45 UTC Central Alaska 2.5 0.0 USGS
Sunday January 1 2012, 00:50:09 UTC Santa Cruz Islands 5.2 77.6 USGS
Sunday January 1 2012, 00:43:05 UTC Southern Alaska 2.1 142.2 USGS
Sunday January 1 2012, 00:37:25 UTC Central Alaska 3.0 63.3 USGS
Sunday January 1 2012, 00:30:06 UTC south of the Mariana Islands 5.1 18.1 USGS
Saturday December 31 2011, 22:49:33 UTC Bonin Islands, Japan region 4.8 694.1 USGS
Saturday December 31 2011, 20:35:03 UTC Southern Alaska 2.4 97.0 USGS
Saturday December 31 2011, 20:05:01 UTC Youngstown-Akron urban area, Ohio 4.0 5.0 USGS
Saturday December 31 2011, 20:04:58 UTC Youngstown-Akron urban area, Ohio 4.0 2.2 USGS
Saturday December 31 2011, 19:39:50 UTC Central Alaska 3.2 23.5 USGS
Saturday December 31 2011, 19:14:45 UTC Baja California, Mexico 3.2 12.7 USGS
Saturday December 31 2011, 17:10:33 UTC off coast Costa Rica 4.6 51.8 USGS
Saturday December 31 2011, 16:36:05 UTC Nevada 2.0 21.3 USGS
Saturday December 31 2011, 16:32:49 UTC Northern California 1.6 2.2 USGS
Saturday December 31 2011, 16:15:08 UTC Salta, Argentina 5.3 13.1 USGS
Saturday December 31 2011, 15:12:15 UTC Northern California 1.1 0.7 USGS
Saturday December 31 2011, 15:05:16 UTC Northern California 2.2 0.9 USGS
Saturday December 31 2011, 14:53:14 UTC Northern California 1.8 2.6 USGS
Saturday December 31 2011, 14:40:56 UTC Central Alaska 2.2 83.9 USGS
Saturday December 31 2011, 14:33:19 UTC Central Alaska 2.2 111.5 USGS
Saturday December 31 2011, 14:31:02 UTC Central Alaska 1.6 4.5 USGS
Saturday December 31 2011, 14:13:17 UTC Southern Alaska 1.9 15.0 USGS
Saturday December 31 2011, 13:42:16 UTC Northern California 1.3 2.7 USGS
Saturday December 31 2011, 13:20:42 UTC Central California 1.9 5.0 USGS
Saturday December 31 2011, 13:16:27 UTC Southern California 1.5 0.1 USGS
Saturday December 31 2011, 12:47:11 UTC Northern California 1.9 2.6 USGS
Saturday December 31 2011, 11:43:57 UTC Northern California 1.4 2.7 USGS
Saturday December 31 2011, 10:47:55 UTC Nevada 2.0 6.5 USGS
Saturday December 31 2011, 10:23:16 UTC Fox Islands, Aleutian Islands, Alaska 3.0 29.0 USGS
Saturday December 31 2011, 10:20:56 UTC Island of Hawaii, Hawaii 2.9 37.7 USGS
Saturday December 31 2011, 09:55:00 UTC offshore Guatemala 4.3 60.5 USGS
Saturday December 31 2011, 09:13:17 UTC Turkey-Iran-Iraq border region 4.4 18.7 USGS
Saturday December 31 2011, 08:56:54 UTC Northern California 2.1 2.3 USGS
Saturday December 31 2011, 08:07:18 UTC Oklahoma 3.5 5.0 USGS
Saturday December 31 2011, 07:43:59 UTC Nevada 1.7 0.2 USGS
Saturday December 31 2011, 07:06:00 UTC Island of Hawaii, Hawaii 1.9 32.8 USGS
Saturday December 31 2011, 06:14:42 UTC Kepulauan Sula, Indonesia 4.9 42.1 USGS
Saturday December 31 2011, 05:39:52 UTC Pakistan 4.9 31.3 USGS
Saturday December 31 2011, 05:02:07 UTC Central California 2.4 4.6 USGS
Saturday December 31 2011, 04:49:59 UTC Northern California 1.4 1.6 USGS
Saturday December 31 2011, 04:30:26 UTC Northern California 1.5 2.3 USGS
Saturday December 31 2011, 04:25:37 UTC Northern California 2.0 2.9 USGS
Saturday December 31 2011, 04:05:44 UTC Kepulauan Sula, Indonesia 4.8 19.8 USGS
Saturday December 31 2011, 03:57:03 UTC Banda Sea 4.6 73.1 USGS
Saturday December 31 2011, 03:54:11 UTC Oklahoma 2.1 5.0 USGS
Saturday December 31 2011, 03:10:08 UTC Island of Hawaii, Hawaii 2.7 7.7 USGS
Saturday December 31 2011, 01:30:22 UTC Kenai Peninsula, Alaska 2.3 47.8 USGS
Saturday December 31 2011, 01:29:36 UTC Kenai Peninsula, Alaska 2.4 39.8 USGS
Saturday December 31 2011, 01:20:30 UTC Puerto Rico region 2.7 28.4 USGS
Saturday December 31 2011, 01:07:27 UTC Southern California 2.2 3.7 USGS
Saturday December 31 2011, 00:53:56 UTC Colombia 4.7 106.0 USGS
Saturday December 31 2011, 00:44:46 UTC South Island of New Zealand 5.3 10.1 USGS
Saturday December 31 2011, 00:24:26 UTC New Guinea, Papua New Guinea 4.9 37.5 USGS

Saturday December 31 2011, 00:08:27 UTC Southern Alaska 2.0 59.9 USGS
Friday December 30 2011, 23:11:07 UTC near east coast Honshu, Japan 4.8 20.9 USGS
Friday December 30 2011, 23:06:13 UTC northern Alaska 2.2 4.6 USGS
Friday December 30 2011, 22:58:27 UTC Southern Alaska 2.0 61.9 USGS
Friday December 30 2011, 22:55:32 UTC Northern California 2.1 29.4 USGS
Friday December 30 2011, 22:35:40 UTC Northern California 1.9 1.8 USGS
Friday December 30 2011, 22:30:20 UTC south of Kermadec Islands 4.7 41.1 USGS
Friday December 30 2011, 22:25:41 UTC Northern California 2.1 30.1 USGS
Friday December 30 2011, 22:15:49 UTC Northern California 1.6 33.7 USGS
Friday December 30 2011, 22:04:07 UTC Northern California 1.4 31.2 USGS
Friday December 30 2011, 21:43:19 UTC south of the Kermadec Islands 5.2 34.6 USGS
Friday December 30 2011, 20:42:46 UTC Greater Los Angeles area, California 1.6 16.0 USGS
Friday December 30 2011, 20:03:47 UTC San Francisco Bay area, California 1.5 0.7 USGS
Friday December 30 2011, 18:49:59 UTC Vanuatu region 4.9 26.2 USGS
Friday December 30 2011, 17:29:54 UTC south of Kermadec Islands 5.0 9.8 USGS

Friday December 30 2011, 17:29:33 UTC Central California 2.3 7.8 USGS
Friday December 30 2011, 17:24:29 UTC Alaska Peninsula 2.9 200.4 USGS
Friday December 30 2011, 17:13:57 UTC Central Alaska 2.9 141.4 USGS
Friday December 30 2011, 17:07:21 UTC Izu Islands, Japan region 5.2 397.9 USGS
Friday December 30 2011, 16:34:34 UTC South Sandwich Islands region 5.2 106.2 USGS

Friday December 30 2011, 16:32:44 UTC Baja California, Mexico 2.7 10.0 USGS
Friday December 30 2011, 16:31:18 UTC Southern California 2.0 12.6 USGS
Friday December 30 2011, 16:19:06 UTC Central California 2.2 4.4 USGS
Friday December 30 2011, 16:09:32 UTC western Montana 3.2 6.2 USGS
Friday December 30 2011, 15:55:54 UTC Baja California, Mexico 3.0 21.1 USGS
Friday December 30 2011, 15:55:54 UTC Baja California, Mexico 2.8 10.0 USGS
Friday December 30 2011, 15:50:12 UTC Baja California, Mexico 3.1 10.0 USGS
Friday December 30 2011, 15:48:23 UTC Virgin Islands region 3.4 72.4 USGS
Friday December 30 2011, 15:34:29 UTC Baja California, Mexico 4.3 10.0 USGS
Friday December 30 2011, 14:18:52 UTC Nevada 2.4 11.7 USGS
31 Dec 2011 1:44pm NZDT Heron St, Southshore, Christchurch 8062, New Zealand 4.82 10.0 Crowe
Friday December 30 2011, 13:17:58 UTC Guam region 4.6 19.1 USGS
Friday December 30 2011, 12:59:52 UTC Baja California, Mexico 2.9 20.9 USGS
Friday December 30 2011, 12:35:19 UTC Rat Islands, Aleutian Islands, Alaska 4.5 30.2 USGS
Friday December 30 2011, 12:23:17 UTC near east coast Kamchatka Peninsula, Russia 4.4 55.9 USGS
Friday December 30 2011, 12:17:44 UTC Pacific-Antarctic Ridge 4.6 10.0 USGS
Friday December 30 2011, 12:10:06 UTC Utah 1.6 0.3 USGS
Friday December 30 2011, 12:10:06 UTC Northern California 2.3 2.7 USGS
Friday December 30 2011, 12:06:18 UTC Island of Hawaii, Hawaii 1.7 6.4 USGS
Friday December 30 2011, 11:53:54 UTC Southern Alaska 3.0 62.2 USGS
Friday December 30 2011, 10:49:31 UTC Canada 2.6 46.0 Natural Resources Canada
Friday December 30 2011, 10:49:30 UTC Maine 2.0 7.7 USGS
Friday December 30 2011, 10:35:30 UTC Hawaii region, Hawaii 2.6 39.4 USGS
Friday December 30 2011, 09:36:29 UTC south of the Fiji Islands 4.7 221.2 USGS
Friday December 30 2011, 09:34:50 UTC near east coast Honshu, Japan 4.6 68.0 USGS
Friday December 30 2011, 09:22:16 UTC near coast central Peru 5.1 51.3 USGS
Friday December 30 2011, 08:51:58 UTC southern Sumatra, Indonesia 5.5 60.8 USGS
Friday December 30 2011, 08:46:42 UTC New Britain region, Papua New Guinea 5.0 53.5 USGS

Friday December 30 2011, 08:42:23 UTC Southern Yukon Territory, Canada 2.1 13.0 USGS
Friday December 30 2011, 08:11:29 UTC Long Valley area, California 1.4 3.1 USGS
Friday December 30 2011, 08:05:45 UTC Rat Islands, Aleutian Islands, Alaska 4.7 62.9 USGS
Friday December 30 2011, 08:03:43 UTC Canada 2.5 84.0 Natural Resources Canada
Friday December 30 2011, 07:41:28 UTC Canada 2.5 23.0 Natural Resources Canada
Friday December 30 2011, 07:13:02 UTC Ecuador 4.6 126.4 USGS
Friday December 30 2011, 06:26:05 UTC Canada 3.2 25.0 Natural Resources Canada
Friday December 30 2011, 06:00:07 UTC Greater Los Angeles area, California 1.4 16.7 USGS
Friday December 30 2011, 05:35:07 UTC San Francisco Bay area, California 1.9 5.8 USGS
Friday December 30 2011, 05:30:52 UTC Central California 1.7 4.7 USGS
Friday December 30 2011, 05:25:22 UTC Southern California 2.1 6.2 USGS
Friday December 30 2011, 04:59:52 UTC Hokkaido, Japan region 4.4 67.0 USGS
2011/12/30 03:46:15 FIJI REGION 4.4 513.6 USGS
Friday December 30 2011, 02:46:42 UTC Southern California 2.0 6.9 USGS
Friday December 30 2011, 02:29:53 UTC Southern California 1.8 10.6 USGS
Friday December 30 2011, 02:18:50 UTC Central California 3.0 9.3 USGS
Friday December 30 2011, 01:45:02 UTC Halmahera, Indonesia 4.8 87.3 USGS
Friday December 30 2011, 00:35:47 UTC eastern Turkey 4.3 4.9 USGS
Thursday December 29 2011, 22:56:01 UTC Central California 2.3 6.7 USGS
Thursday December 29 2011, 22:54:11 UTC Southern California 2.4 18.8 USGS
Thursday December 29 2011, 22:25:50 UTC Bougainville region, Papua New Guinea 5.3 505.0 USGS
Thursday December 29 2011, 20:34:59 UTC offshore Chiapas, Mexico 4.6 102.0 USGS
Thursday December 29 2011, 20:05:50 UTC Vanuatu 5.3 40.9 USGS
Thursday December 29 2011, 19:19:54 UTC Baja California, Mexico 2.8 22.4 USGS
Thursday December 29 2011, 18:28:18 UTC Fox Islands, Aleutian Islands, Alaska 4.4 25.6 USGS
Thursday December 29 2011, 18:17:33 UTC Central California 1.7 1.8 USGS
Thursday December 29 2011, 17:15:20 UTC Central California 2.0 4.9 USGS
30 Dec 2011 4:45am NZDT 351 Kainga Rd, Brooklands, Christchurch 8083, New Zealand 4.37 13.0 Crowe
Thursday December 29 2011, 16:31:53 UTC Central Alaska 2.5 21.8 USGS
Thursday December 29 2011, 15:06:31 UTC southeastern Missouri 2.8 7.8 USGS
Thursday December 29 2011, 13:58:55 UTC south of the Kermadec Islands 4.6 248.8 USGS
Thursday December 29 2011, 13:45:41 UTC near the coast of central Peru 4.8 77.5 USGS

Thursday December 29 2011, 12:54:09 UTC Oregon 1.6 3.4 USGS
Thursday December 29 2011, 12:53:04 UTC Oregon 1.9 9.6 USGS
Thursday December 29 2011, 11:58:29 UTC northern Colombia 4.3 147.3 USGS
Thursday December 29 2011, 11:48:10 UTC western Texas 2.5 4.9 USGS
29 Dec 2011 10:48pm NZDT 165E Rocking Horse Rd, Southshore, Christchurch 8062, New Zealand 4.32 12.1 Crowe
Thursday December 29 2011, 10:40:06 UTC Puerto Rico region 2.1 19.0 USGS
Thursday December 29 2011, 09:03:36 UTC western Montana 2.2 12.3 USGS
Thursday December 29 2011, 08:58:03 UTC Puerto Rico region 2.7 29.2 USGS
Thursday December 29 2011, 08:08:42 UTC Central California 2.1 6.1 USGS
Thursday December 29 2011, 07:51:04 UTC Northern California 2.2 6.1 USGS
Thursday December 29 2011, 07:48:17 UTC Northern California 2.1 0.3 USGS
Thursday December 29 2011, 07:25:10 UTC Southern Alaska 2.0 4.8 USGS
Thursday December 29 2011, 07:17:00 UTC Central Alaska 2.0 3.6 USGS
Thursday December 29 2011, 07:13:46 UTC Central Alaska 1.7 0.0 USGS
Thursday December 29 2011, 06:46:38 UTC Utah 1.5 6.9 USGS
Thursday December 29 2011, 06:44:46 UTC Utah 1.6 8.6 USGS
Thursday December 29 2011, 05:40:21 UTC Canada 2.2 93.0 Natural Resources Canada
Thursday December 29 2011, 05:19:58 UTC Guatemala 4.6 10.2 USGS
Thursday December 29 2011, 05:06:41 UTC Kodiak Island region, Alaska 3.6 58.2 USGS
Thursday December 29 2011, 04:41:05 UTC Fox Islands, Aleutian Islands, Alaska 2.9 4.2 USGS
Thursday December 29 2011, 04:18:38 UTC Southern Alaska 2.4 20.5 USGS
Thursday December 29 2011, 04:09:15 UTC Northern California 2.4 1.5 USGS
Thursday December 29 2011, 03:32:46 UTC southern Peru 4.6 197.3 USGS
Thursday December 29 2011, 01:12:03 UTC Southern California 2.5 16.7 USGS
Thursday December 29 2011, 00:49:47 UTC Northern California 2.4 2.6 USGS
Thursday December 29 2011, 00:30:56 UTC Pacific-Antarctic Ridge 5.5 16.9 USGS
Wednesday December 28 2011, 23:39:22 UTC Central Alaska 1.0 0.3 USGS
Wednesday December 28 2011, 23:21:03 UTC Central Alaska 2.0 31.1 USGS
Wednesday December 28 2011, 23:05:37 UTC Nevada 1.7 25.8 USGS
Wednesday December 28 2011, 22:47:13 UTC Central Alaska 2.0 1.9 USGS
Wednesday December 28 2011, 22:11:47 UTC British Columbia, Canada 2.4 0.0 USGS
Wednesday December 28 2011, 21:56:32 UTC Alaska Peninsula 2.2 1.3 USGS
Wednesday December 28 2011, 21:55:43 UTC Tonga 5.1 238.9 USGS
Wednesday December 28 2011, 21:45:53 UTC Oaxaca, Mexico 4.4 64.3 USGS
Wednesday December 28 2011, 21:03:33 UTC Southern California 1.4 17.3 USGS
Wednesday December 28 2011, 20:45:33 UTC San Francisco Bay area, California 1.5 0.1 USGS
Wednesday December 28 2011, 20:32:31 UTC South Sandwich Islands region 5.4 31.0 USGS
Wednesday December 28 2011, 18:42:02 UTC Puerto Rico region 2.5 72.2 USGS
Wednesday December 28 2011, 18:16:04 UTC Kenai Peninsula, Alaska 2.4 33.4 USGS
Wednesday December 28 2011, 18:14:34 UTC Southern California 2.1 4.0 USGS
Wednesday December 28 2011, 17:57:28 UTC Greater Los Angeles area, California 2.2 5.1 USGS
Wednesday December 28 2011, 17:50:12 UTC Southern Alaska 2.6 105.4 USGS
Wednesday December 28 2011, 17:33:55 UTC Halmahera, Indonesia 5.4 159.7 USGS
Wednesday December 28 2011, 16:47:30 UTC Greater Los Angeles area, California 1.9 5.7 USGS
Wednesday December 28 2011, 16:27:39 UTC Mindanao, Philippines 4.6 87.6 USGS
Wednesday December 28 2011, 16:12:22 UTC Canada 2.7 35.0 Natural Resources Canada
Wednesday December 28 2011, 15:49:28 UTC northern Alaska 3.0 11.1 USGS
Wednesday December 28 2011, 15:25:42 UTC southwestern Siberia, Russia 4.6 15.5 USGS
Wednesday December 28 2011, 15:20:42 UTC San Francisco Bay area, California 1.9 7.0 USGS
Wednesday December 28 2011, 15:19:57 UTC Island of Hawaii, Hawaii 1.8 6.3 USGS
Wednesday December 28 2011, 14:53:36 UTC Kodiak Island region, Alaska 2.8 11.7 USGS
Wednesday December 28 2011, 14:23:50 UTC southwest of Sumatra, Indonesia 4.7 17.9 USGS
Wednesday December 28 2011, 14:00:35 UTC Baja California, Mexico 2.1 9.8 USGS
Wednesday December 28 2011, 13:54:34 UTC southwestern Siberia, Russia 4.6 10.0 USGS
Wednesday December 28 2011, 13:13:03 UTC Puerto Rico region 2.8 101.5 USGS
Wednesday December 28 2011, 12:45:11 UTC Fox Islands, Aleutian Islands, Alaska 2.2 77.9 USGS
Wednesday December 28 2011, 11:43:41 UTC Atacama, Chile 4.9 41.9 USGS
Wednesday December 28 2011, 11:05:10 UTC New Mexico 2.5 5.0 USGS
Wednesday December 28 2011, 10:45:41 UTC Canada 2.6 32.0 Natural Resources Canada
Wednesday December 28 2011, 10:35:37 UTC New Britain region, Papua New Guinea 4.4 35.0 USGS
Wednesday December 28 2011, 10:07:05 UTC Puerto Rico region 3.0 17.3 USGS
Wednesday December 28 2011, 09:18:32 UTC Kuril Islands 4.7 62.0 USGS
Wednesday December 28 2011, 08:28:35 UTC Virgin Islands region 2.5 25.6 USGS
Wednesday December 28 2011, 06:59:14 UTC Southern California 2.9 8.5 USGS
Wednesday December 28 2011, 06:38:59 UTC Fiji region 5.2 613.7 USGS

List follows on from NZ Kermadec quakes on page; extract:
Friday December 23 2011, 17:37:30 UTC South Island of New Zealand 5.0 7.6 USGS
Friday December 23 2011, 10:52:06 UTC south of the Kermadec Islands 5.5 10.0 USGS
Friday December 23 2011, 03:50:12 UTC east coast South Island New Zealand 4.8 8.4 USGS
Friday December 23 2011, 02:18:02 UTC South Island of New Zealand 5.9 4.9 USGS
Friday December 23 2011, 01:41:37 UTC South Island of New Zealand 4.0 11.2 USGS
Friday December 23 2011, 01:30:24 UTC South Island of New Zealand 4.2 5.0 USGS
Friday December 23 2011, 01:06:25 UTC South Island of New Zealand 5.3 3.7 USGS

Wednesday December 21 2011, 13:37:14 UTC south of Kermadec Islands 5.5 10.0 USGS
= Magnitude 5.7, Thursday, December 22 2011 at 2:37 am (NZDT), 200 km south of L’Esperance Rock GeoNet

[1]

Pegasus Bay and East Cape NZ mag 5.0 quakes - GNS seismograph drums 060112e
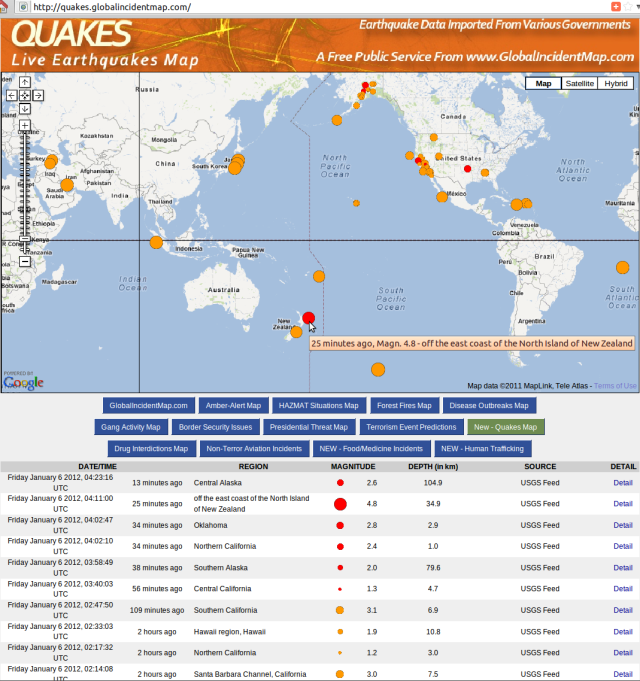
Pegasus Bay and East Cape NZ mag 5.0 quakes - GNS seismograph drums 060112e


Pegasus Bay and East Cape NZ mag 5.0 quakes - GIM 060112
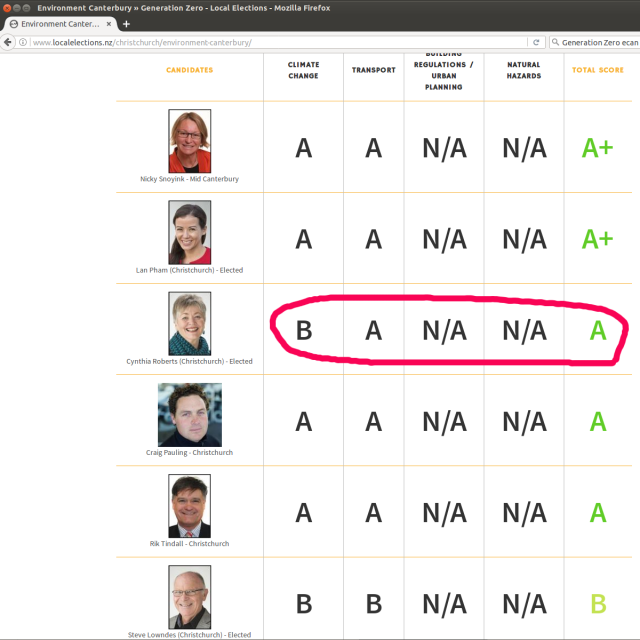
Pegasus Bay and East Cape NZ mag 5.0 quakes - GIM 060112